This shuttle is launching into orbit around the Earth to connect to the International Space Station (ISS). Make a prediction for when it will reach its maximum altitude.

Overview
Students will use spreadsheet software (Microsoft Excel, Google Sheets) to learn about the relationship between time, distance, velocity, and acceleration and develop skills with visualizing and analyzing data.
Standards
Next Generation Science Standards
- Physical Science
- [HS-PS2] Motion and Stability: Forces and Interactions
Computational Thinking in STEM
- Data Practices
- Analyzing Data
- Visualizing Data
Activities
- 1. Introduction
- 2. Using Spreadsheet Software to Create Visualize Launch Data
- 3. Analyze and interpret graphs to gain insight into the stages of the shuttle ascent
- 4. Reflection
Student Directions and Resources
Students will use spreadsheet software (Microsoft Excel, Google Sheets) to learn about the relationship between time, distance, velocity, and acceleration and develop skills with visualizing and analyzing data.
You will need the following resources to complete this assignment.
1. Introduction
1. Watch video from 1:15-2:15: Shuttle Discovery Launch STS-121 (NASA) July 4th, 2006
2. Space Shuttle Ascent Background Information
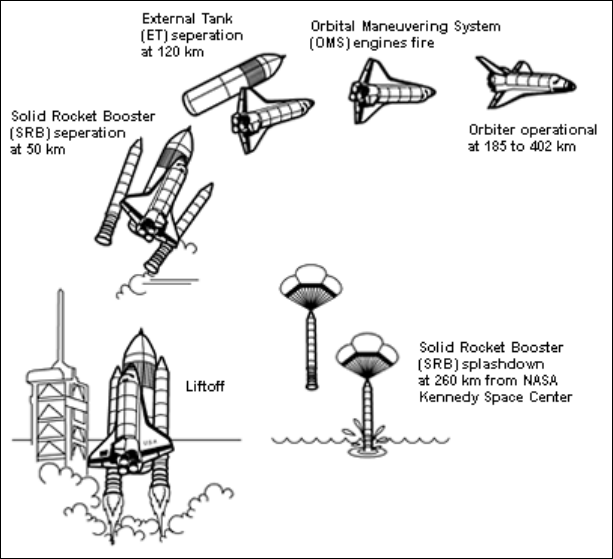
Since its first flight in 1981, the space shuttle has been used to extend research, repair satellites, and help with building the International Space Station, or ISS. In 2011, the Space Shuttle was retired in favor of new space exploration vehicles. Space exploration depends on the continued success of space shuttle missions. Critical to any space shuttle mission is the ascent into space. The ascent phase begins at liftoff, goes through a first stage ascent using two Solid Rocket Boosters (SRB), goes through a second stage ascent using an external tank, and ends at insertion into a circular or elliptical orbit around the Earth. To reach the minimum altitude required to orbit the Earth, the space shuttle must accelerate from zero to 8,000 meters per second (almost 18,000 miles per hour) in eight and a half minutes. (www.nasa.gov)
3. Lesson Overview
Today we are going to use flight data from mission STS-121’s launch to create graphs to investigate the motion of a NASA space shuttle in ascent. Our goal is to understand the relationship between its altitude, velocity, and acceleration.
4. The Value of Computational Thinking

Before each mission, projected data is compiled to assist in the launch of the space shuttle to ensure safety and success during the ascent. To complete this data, flight design specialists take into consideration a multitude of factors such as the weight of the space shuttle, propellant used, mass of payload being carried to space, and mass of payload returning. They must also factor in atmospheric density, which is changing throughout the year. After running multiple scenarios through computer modeling, information is compiled in a table showing exactly what should happen each second of the ascent. This information helps the NASA engineers and flight controllers to quickly evaluate whether or not the space shuttle is operating as expected during the launch phase.
Data from the actual flight helps us understand the motion of the shuttle and prepares us to develop more accurate computer models. Understanding a phenomenon involves moving back and forth between flight data and data from computer simulations.
Question 1.1
Question 1.2
Make a prediction for when it will reach its maximum velocity.
Question 1.3
Make a prediction for when it will reach its maximum acceleration.
2. Using Spreadsheet Software to Create Visualize Launch Data
NASA Data from Mission STS-121
Microsoft Excel
- Open the spreadsheet of flight data from NASA mission STS-121.
- Highlight the time and altitude columns (cells A1:B28) and select Charts>Scatter to create a chart that displays the altitude data.
- Highlight the time and velocity columns (using CTRL/CMD) and select Charts>Scatter to create a chart that displays the velocity data.
- Highlight the time and acceleration columns (using CTRL/CMD) and select Charts>Scatter to create a chart that displays the acceleration data.
Google Sheets
- Open the spreadsheet of flight data from NASA mission STS-121.
- Highlight the time and altitude columns (cells A1:B28) and select the Insert Chart icon
. Select the chart recommendation that you think displays the data most effectively and click insert.
- Highlight the time, altitude, and velocity columns (cells A1:C28) and select the Insert Chart icon
- Highlight the acceleration column (cells D1:D28) and select the Insert Chart icon
Question 2.1
Extending: Try visualizing altitude, velocity, and acceleration on the same chart. Is this helpful? Explain why or why not.
Question 2.2
Upload a screenshot of your graphs or the file containg the graphs you created.
Upload files that are less than 5MB in size.
| File | Delete |
|---|---|
Upload files to the space allocated by your teacher.
3. Analyze and interpret graphs to gain insight into the stages of the shuttle ascent
What is happening in the graphs and what is happening to the space shuttle as it ascends?
Question 3.1
Tell the story of the space shuttle and its boosters considering the ALTITUDE graph.
Question 3.2
Tell the story of the space shuttle and its boosters considering the VELOCITY graph.
Question 3.3
Tell the story of the space shuttle and its boosters considering the ACCELERATION graph.
Question 3.4
What is happening in the altitude and velocity graphs from 340 - 520 seconds? Make a hypothesis for what is going on with the shuttle that might explain the two graphs.
Question 3.5
Write a paragraph explaining the story of the space shuttle’s ascent with respect to the boosters and motion relative to the surface of the earth. Use the terms altitude, velocity, and acceleration in your explanation.
4. Reflection
Today we used flight data from a space shuttle launch to create graphs to investigate the motion of the shuttle in ascent. We investigated the relationship between its altitude, velocity, and acceleration and found that the shuttle’s altitude changed based on its velocity and its velocity changed based on its acceleration.
When Computational Scientists are developing a computer model of a phenomenon, they start by investigating the phenomenon. This is the value of investigating the altitude, velocity, and acceleration of an ascending shuttle. As our computer models improve, we can better monitor the progress of a shuttle and determine whether the flight is going according to plan.
Question 4.1
How is what you did today a version of what computational scientists do in the real world?
Question 4.2
What are the advantages of using computational thinking and computational tools to understand a space shuttle ascent?
Question 4.3
How does the process of visualizing the data and analyzing altitude, velocity, and acceleration provide insight into the shuttle’s ascent?
