

Do you support the Des Moines Water Works sueing drainage districts in three rural northwest Iowa counties? Why or why not?

Overview
Students use a public database to learn about water quality and develop skills with data retrieval.
Standards
Activities
- 1. Introduction: Water Quality Issues
- 2. Retrieve Nitrate Pollution Data
- 3. Reflection
Student Directions and Resources
Students use a public database to learn about water quality and develop skills with data retrieval.
1. Introduction: Water Quality Issues
There are few things more important than water.
Today you will read about nitrate water pollution and use a public water quality database to collect data so that you can evaluate which locations have a nitrate pollution problem. Public databases give access to huge amounts of data that would be impossible to collect and analyze without computational tools.
In July, 2015, the Des Moines Register reported to following:
More than 60 Iowa cities and towns have battled high nitrate levels in their drinking water over the past five years, evidence of a contamination problem that reaches across the state, state environmental data show.
The issue of nitrate contamination drew heightened attention this spring when Des Moines Water Works sued drainage districts in three rural northwest Iowa counties, saying their tile lines exacerbate nitrate pollution.
"Many communities have been struggling with this issue for years and years," said Susan Heathcote, water program director at the Iowa Environmental Council. "It's not just people living in Des Moines who are concerned with reducing nitrates."
The federal government requires that nitrates not exceed 10 milligrams per liter of water — a level that without treatment can be deadly to infants 6 months and younger, the U.S. Environmental Protection Agency says.
Source: Eller, Donnelle. "High Nitrate Levels Plague 60 Iowa Cities, Data Show." Des Moines Register. N.p., 04 July 2015. Web. 18 July 2016.
What is nitrate?
Nitrate (NO3-) and nitrite (NO2-) are a naturally occurring polyatomic ions made of nitrogen and oxygen. Nitrate is found in air, soil, water, and plants. Much of the nitrate in our environment comes from decomposition of plants and animal wastes. People also add nitrate to the environment in the form of fertilizers. You can read more about nitrate here and about nitrates in water here (http://water.usgs.gov/edu/nitrogen.html).
Water: the “Universal Solvent”
“Water is capable of dissolving a variety of different substances, which is why it is such a good solvent. In fact, water is called the "universal solvent" because it dissolves more substances than any other liquid. This is important to every living thing on earth. It means that wherever water goes, either through the air, the ground, or through our bodies, it takes along valuable chemicals, minerals, and nutrients.” (USGS Water Science School, http://water.usgs.gov/edu/solvent.html)
Question 1.1
Question 1.2
What leads to elevated nitrate levels in the water?
Question 1.3
Why does nitrate dissolve in water?
Question 1.4
Concerned about high nitrate levels, someone considers boiling water before drinking it. Would this reduce nitrate levels?
2. Retrieve Nitrate Pollution Data
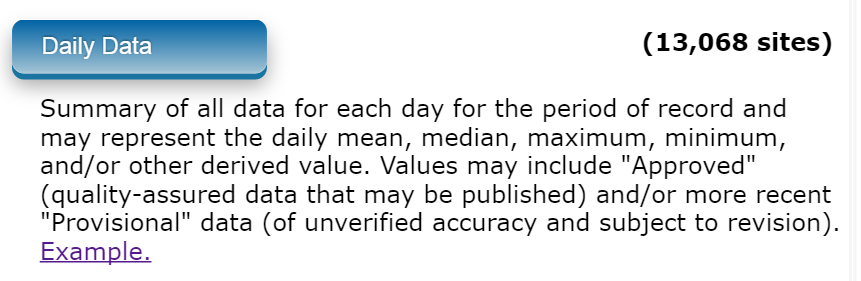
Step 1: Visit "USGS Water-Quality Data for the Nation" (http://waterdata.usgs.gov/nwis/qw) and click "Daily Data"
Step 2: Select data parameters
-
Under “State/Territory” select “Iowa”

-
Under Water Quality Parameters select "Nitrate plus nitrite, water, in situ, mg/L as N”
-
SEARCH TIP: “Ctrl+F” (FIND) “nitrate"
-
Note: For drinking water quality purposes nitrate plus nitrite concentrations are considered to be representative of nitrate concentrations
-

-
Select date range "2015-07-01 through 2016-07-01".

-
Select output options
-
Option 1: Table of data
- After you click SUBMIT, a will open table in browser window. Data will need to be copied and pasted into Excel/Google Sheets for analysis.
-


-
- Option 2: Tab-separated data
- After you click SUBMIT, this downloads a data file which will need to be opened in Google Sheets/Excel
- Make sure it’s saved as a “.tsv” file in the computer’s “Downloads” folder. Just type “.tsv” after typing your data file’s name.
- Option 2: Tab-separated data

STEP 3: Open and save data in Google Sheets/Excel
-
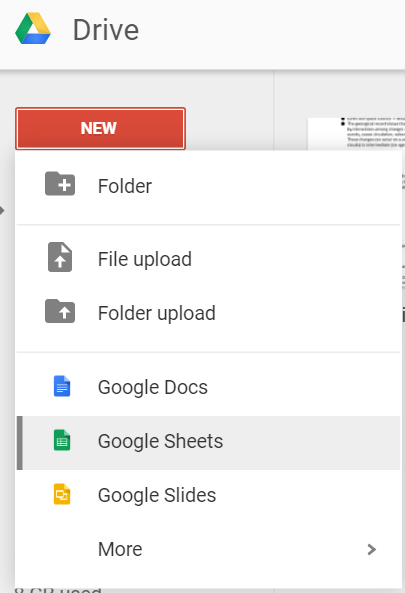
Create a new Google Sheets file
-
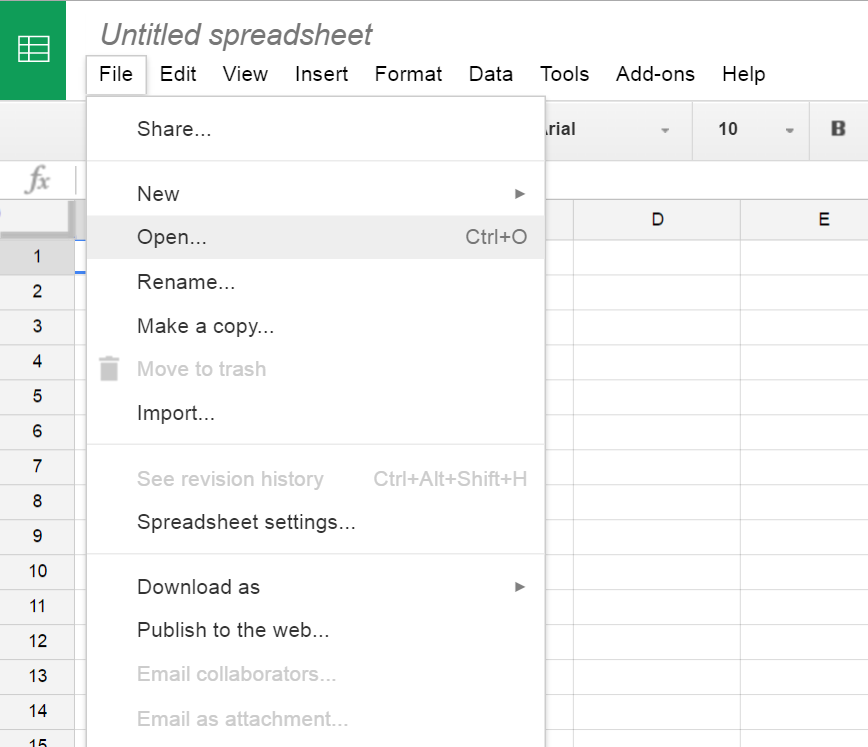
Paste copied data (from HTML table) or, if you downloaded your data as a .tsv file, open the .tsv data file in Google Sheets.
-
Save your document and title it "Nitrate Pollution Data"
Question 2.1
Upload the data that you retrieved or copy a link to your Google sheet in the next question.
Upload files that are less than 5MB in size.
| File | Delete |
|---|---|
Upload files to the space allocated by your teacher.
Question 2.2
If you did not upload your data file, copy a link to your Google sheet
Question 2.3
You selected one year for your date range and the database gives an average for each day.
Reflect on the appropriate data range for which to collect nitrate data. Would a shorter date range (a day, a month) be sufficient for determining if a location has a nitrate problem? Is there a reason to collect data for more than one year?
Question 2.4
Reflect on the appropriate frequency to collect nitrate data. Would more frequent data (e.g, every 15 minutes instead of a daily average) be useful?
Question 2.5
Take a glance at the data you collected. What do you notice? According to the Des Moines Register article from July 2015, the Des Moines water system had a nitrate pollution problem. Without using computational tools, can you tell if it still has one? What about other sites across the state?
3. Reflection
Today you read about nitrate pollution and collected data from the USGS database so that you can determine if and where there is a nitrate problem. In part 2 of this lesson you will use computational tools to analyze the data you have collected.
Question 3.1
You accessed the nation's principal repository of water resources data. It includes data from more than 1.5 million sites, some in operation for more than 100 years. What are advantages/disadvantages of using the USGS water database versus collecting your own water quality data?
