
Overview
In this lesson, students have graphs that show the compiled data from the data snapshot model in lesson 9. Students compare these to the conclusions they developed using the model. They also use this data to think about the differences by season.
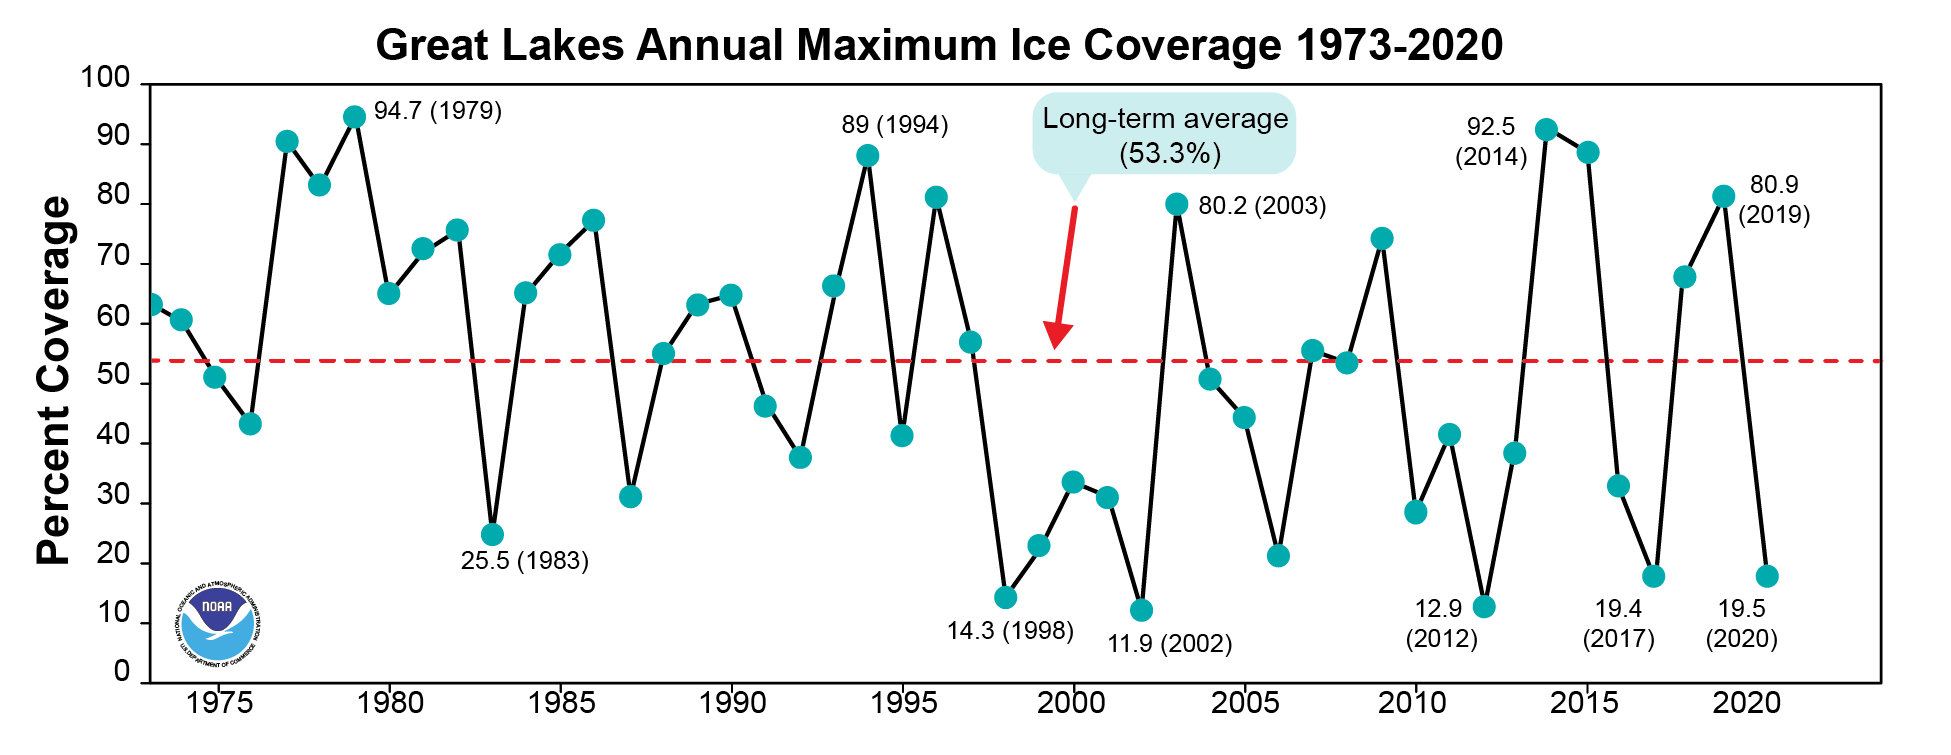
In addition to the data snapshots graphs, there are graphs from GLISA that look at water temperature and lake level trends. They also use this lesson to see the impact of rising temperature on ice cover on the lakes.
Underlying Pages
-
0. Student Directions -
Preview as Student
-
1. Changes in Temperature by Season -
Preview as Student
-
2. Precipitation Differences by Season -
Preview as Student
-
3. Trends in the Great Lakes -
Preview as Student
-
4. Lake Temperature and Lake Levels -
Preview as Student
-
5. Ice Cover in the Great Lakes -
Preview as Student
Standards
Next Generation Science Standards
- Earth and Space Sciences
- NGSS Crosscutting Concept
- NGSS Practice
Computational Thinking in STEM
- Data Practices
- Modeling and Simulation Practices
- Systems Thinking Practices
Credits
ice cover graph: https://www.glerl.noaa.gov/data/ice/imgs/IceCover_avg_1973_2020.png
