It only became widely accepted knowledge that all matter in the world is made up of tiny elementary particles in the early 19th century.
Let's look at the the picture below. Can you tell what it is a model of?

This is an introductory lesson for using certain types of computational models designed using a software called NetLogo. It is intended as a first lesson for educators (teachers and professors) who want to learn how to use NetLogo pedagogically.
In this lesson, educators will learn -
This lesson gets you thinking about computer modeling and how you can use it for science and for learning. It also gives you some insight into NetLogo.
This lesson specifically focuses on learning science with such computational models. These computational models are of emergent natural phenomena. Emergent phenomena are the ones in which simple interactions between autonomous agents and environment result into complex patterns, for example, a flock of birds.
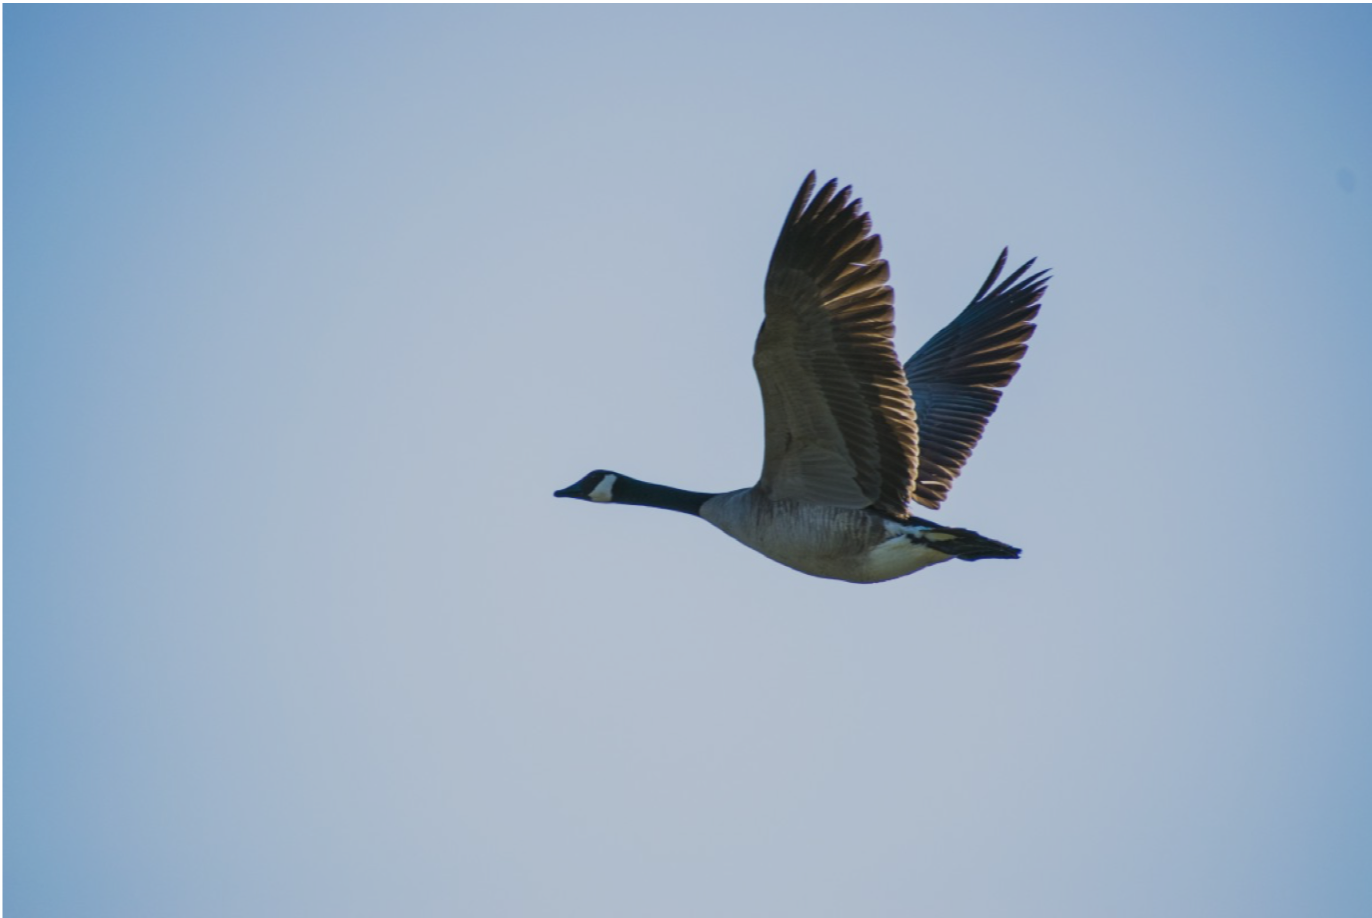
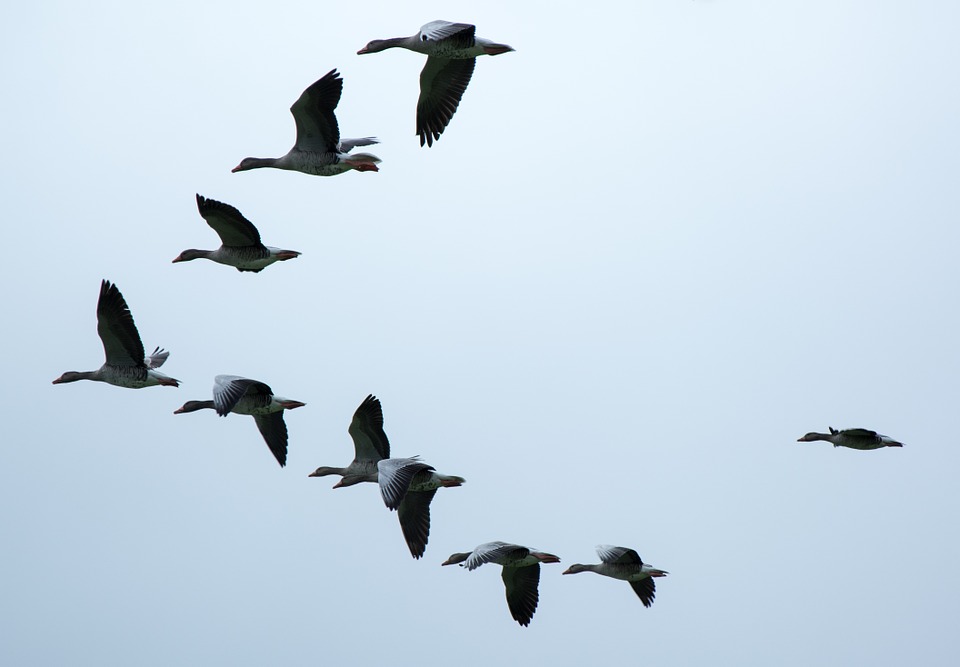
In a flock of birds, each bird follows simple rules regarding alignment, coherence and separation with the neighboring birds, and this results in complex patterns of the flock, such as the V-shape formation.
Learning Goals:
Scientists use scientific modeling approaches to construct knowledge about the world. In this section, we will explore ideas about scientific models.
It only became widely accepted knowledge that all matter in the world is made up of tiny elementary particles in the early 19th century.
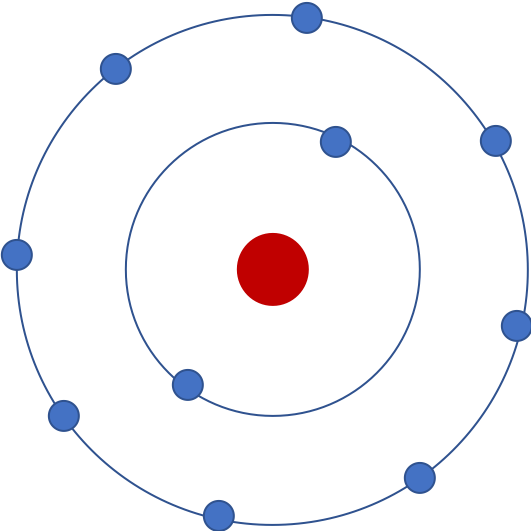
Let's look at the the picture below. Can you tell what it is a model of?
Some would say it is a model of an atom. Some would say it is a model of a 'Neon atom', because it has 10 electrons. It could also be one of several ions, since we don't know the number of protons.
Anyway, the point is that these representations in a model allow us to think about a model and various natural phenomena that are associated with the model in a certain way. Can you explain what this model could be useful for?
Let's look at a computational model of wildfire. Imagine that you are observing a forest using a drone that is hovering on top of a forest. So what you see in the model is the top view of a forest. Each green patch represents a tree. A red patch represents a burning tree.
Play with the model and make some observations.
Describe how this model could be useful for researchers or other people using it.
Change the density of trees in the model and observe the spread of the fire.
In such models, trees are agents. Behavior of agents is programed in the model.
Can you guess, a rule that trees might follow in this model regarding catching fire?
Based on your exploration of the model, can you guess how density of tree affects spread of the fire in the forest?
This 'fire model' is an example of an emergent systems microworld. It is modeled in terms of interactions between the agents (trees) and it allows us to observe emergent patterns regarding the spread of fire in the forest. We can change parameters such as density of trees and study how that would affect the spread of fire in the forest. It also allows us to make some predictions regarding the spread of fire in a forest.
However, this model does not include all the factors that would affect spread of fire in a forest. Can you suggest some factors that can be added in this model?
On the previous page you guessed what the rules for this model might be. Now we will discuss what they are, and identify them in the code.
You may have noticed that at the top of the model interface, it says ticks. When you click setup it will say ticks: 0, and as the model runs, the ticks will increase. Ticks are a way of representing time in the model. So when we are describing the rules of the model, we say what happens each tick. It is also helpful to describe the rules from the perspective of the agents, in this case the trees. The rules for this model are quite simple.
Each tick from the perspective of a tree:
What are the similarities and differences between the rules you guessed on the previous page and these rules?
NetLogo is designed to be “Low Threshold, No Ceiling.” This means that there is very little prerequisite knowledge needed to start using it, but there is no limit to what you can do with it once you master it. Many scientists and professionals regularly use NetLogo for cutting-edge research (see here for a partial list of research papers employing NetLogo).
One of the ways NetLogo achieves a "Low Threshold" is by making the syntax as close to english as possible. Open up the NetLogo Code tab and try to find the code which executes the two rules described in the previous question. (The NetLogo Code tab is the second purple bar underneath the visualization of the model). Copy and paste the code you think corresponds to each rule below.
In the setup procedure of the model, there is code like this:

What would happen if you changed green to blue? Put your hypothesis without actually changing the code yet.
Now go ahead and change green to blue in line 14 of the code. What happens when you setup the model and when you press go? Did something different than you expected happen (or not happen)? If so, explain why this small change had the effect it did.
Let's systematically investigate how the tree density affects the spread of wildfire.
We will first generate some data using the model and then represent it using another computational tool called CODAP (which is similar to Excel).
Research Question: How does density of trees in a forest affect spread of wildfire?
Hypothesis: You already wrote a hypothesis on the first page. Write it (or a revised hypothesis) in question 3.1 below, but don't look at the later questions yet. Just come back here and continue the experiment.
Let's test the hypothesis.
Change the values of density systematically. You can make the model run faster with the model speed slider at the top of the model display: 
Record the value of 'percentage forest burned' in the data table. You can double click the cells of the data table to edit the value. Make sure to press the setup button every time you run an experiment.
Run each experiment twice. Make sure you record values for each experimental trial.
The CODAP software will plot the average of the two values that you record.
Write your hypothesis for how the density of trees affects the percentage burned. You will be plotting percentage burned vs density, so be specific about what you think the shape of the curve will be.
Describe your observations of the graph of 'density' vs 'percentage burned'.
Do you think that the evidence that you gathered supports your hypothesis? Explain.
Spread of wildfire is an emergent phenomenon. Below certain density the fire does not spread much, however when the density crosses a 'tipping point' or threshold, the fire engulfs almost all the forest. The tipping point is not explicitly coded anywhere into the model. Rather, this macro-level pattern "emerges" from the micro-level agent behaviors that are coded into the model.
Tipping point in this model falls within which of the following ranges?
Can you give an example of another such phenomenon with a tipping point?
Explore a more detailed version of the fire model above.
Explain what "probability-of-spread" might mean in the model and how it would affect the behavior of the model.
Write a question that is of an interest to you which can be answered using this model.
An example of such a question would be, how does wind speed affect spread of fire?
Based on your exploration of the model, guess an answer to your question and state it in the form of a testable statement (hypothesis) - something that you can test using the model.
Design an experiment to test your hypothesis. Explain your design.
Perform the experiment. Describe your observations and explain whether those support your hypothesis or not.
This is the end of the first lesson. In the next lesson, we will start learning how to write programs in NetLogo, and then we will start exploring models specific to your field. Please answer the questions below to give feedback on the lesson.
How long did it take you to go through the lesson?
Were there any parts of the lesson that were confusing? Were there parts you think you could have done significantly faster with a little more explanation?
What were your favorite parts of the lesson? What did you learn from them?
Are there parts of the lesson you think should be removed or changed? If you do, please explain why.
Is there anything you think should be added to the lesson?
You can enter any other feedback you have below.
