Thinking about this community of wolves and moose in Isle Royale, do you believe that the size of the wolf population will change from one day to the next?

Unit Overview
Students will develop an understanding of how to develop a computational model starting from basic intuitions about individual behavior, then gradually and iteratively making improvements and adding complexity. They will begin by using block-based programming tools, but will eventually transition to simple text-based programming. Finally, they will learn how to critically evaluate models for their realism and usefulness using data from the Isle Royale ecosystem, and use the model they built over the unit to make predictions about the future of that ecosystem.
Standards
Next Generation Science Standards
Computational Thinking in STEM
- Data Practices
- Analyzing Data
- Manipulating Data
- Visualizing Data
- Modeling and Simulation Practices
- Using Computational Models to Find and Test Solutions
- Using Computational Models to Understand a Concept
- Computational Problem Solving Practices
- Troubleshooting and Debugging
- Systems Thinking Practices
- Investigating a Complex System as a Whole
- Thinking in Levels
- Understanding the Relationships within a System
Credits
Unit designed/developed by Dabholkar, S., Hall K., Woods P., & Bain C.
Acknowledgement
This work is supported by the National Science Foundation (grants CNS-1138461, CNS-1441041 and DRL-1020101) and the Spencer Foundation (grant 201600069). Any opinions, findings, conclusions, and/or recommendations are those of the investigators and do not necessarily reflect the views of the funding organizations.
Underlying Lessons
- Lesson 1. Using Blocks to Model Ecosystems
- Lesson 2. Analyzing the Code Behind the Blocks
- Lesson 3. Moving to Text Based Coding
- Lesson 4. Evaluating the Model
- Lesson 5. Using the Model to Make Predictions
Lesson 1 Overview
This unit introduces computational thinking practices which include data practices, modeling and simulation practices, computational problem solving practices, and systems thinking practices. These practices are introduced to students in the context of a biology unit of ecology and evolution.
Lesson 1 Activities
- 1.1. Modeling Ecosystems
- 1.2. Getting the Wolf to Move
- 1.3. Making the Model More Realistic
1.0. Student Directions and Resources
In this unit, you will build and explore computational models of living systems. A special type of scientists called computational biologists, use such kind of computational models to study biological systems.
This units focuses on prey-predator interactions in an ecosystem. It uses two computational modeling environments - NetTango and NetLogo.
NetTango is a block-based coding environment, whereas NetLogo is text-based coding environment.
As you spend your time learning about how to construct computational models of prey-predator ecosystems, you will learn a bit about coding using blocks as well as text.
1.1. Modeling Ecosystems
Isle Royale
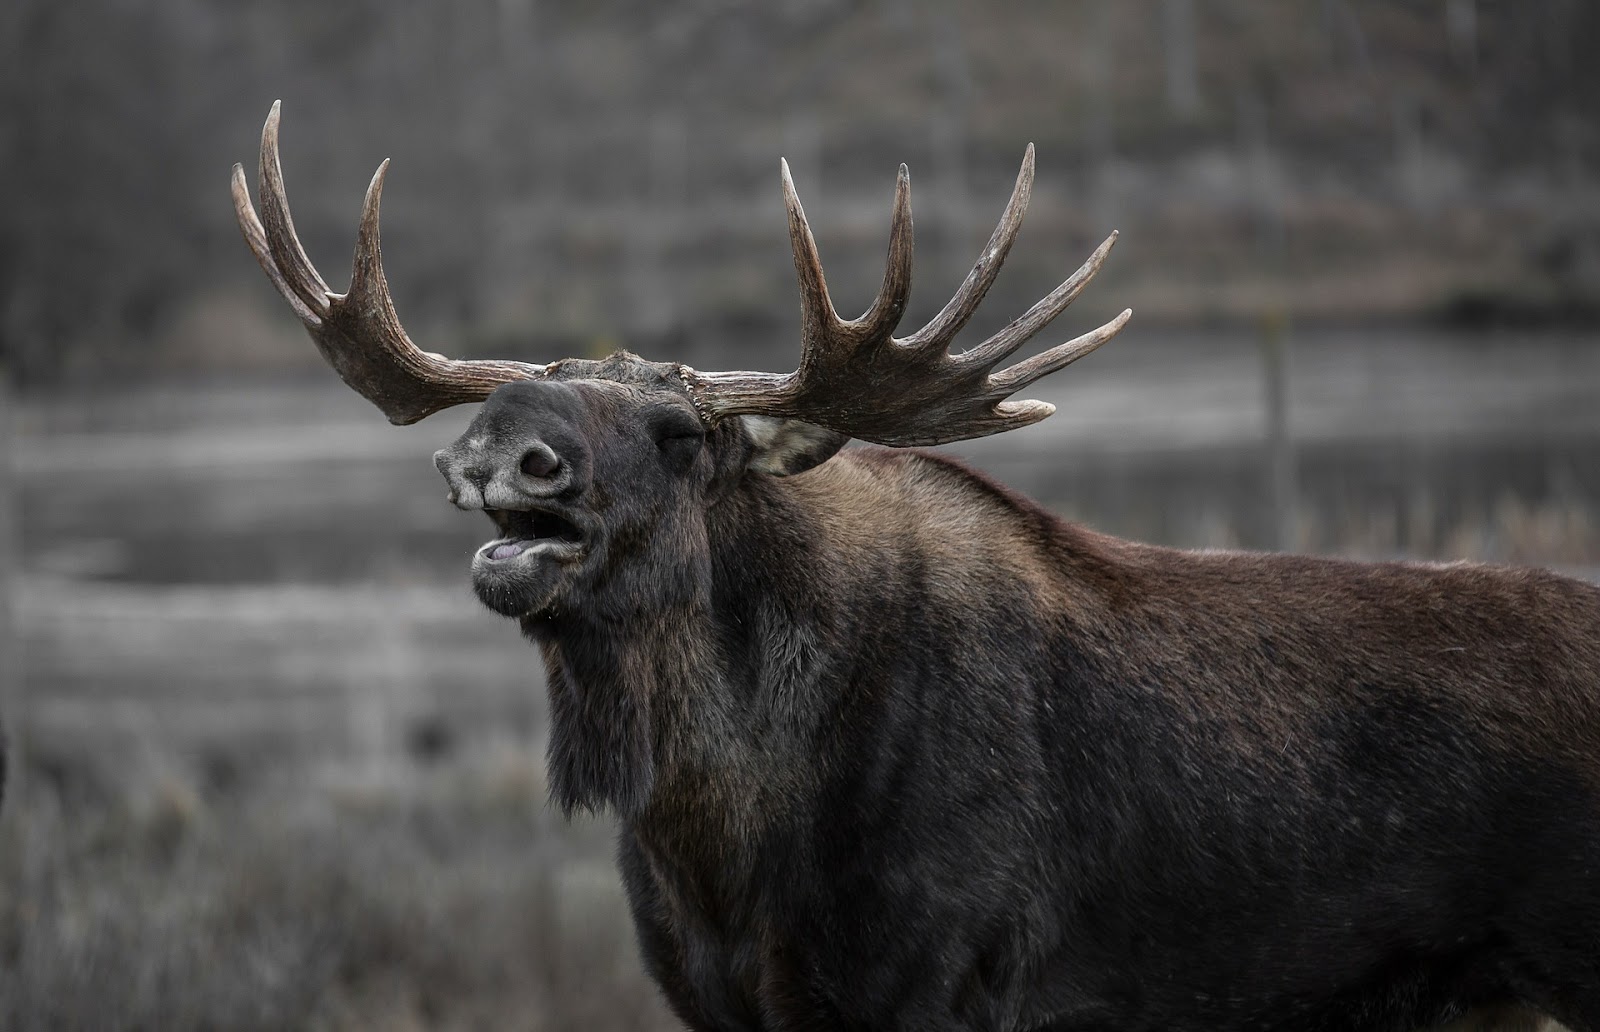
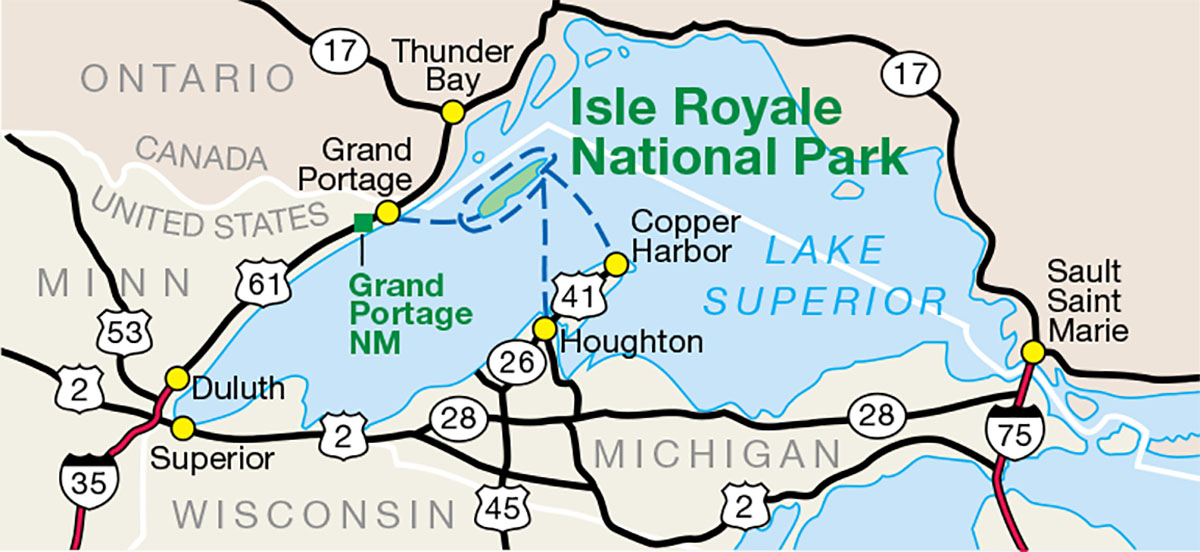
Ecosystems are often difficult to understand because they usually include interactions between a large number of species. Isle Royale is different. It is a relatively simple island ecosystem, located 24 km from the shore of Canada in Lake Superior.

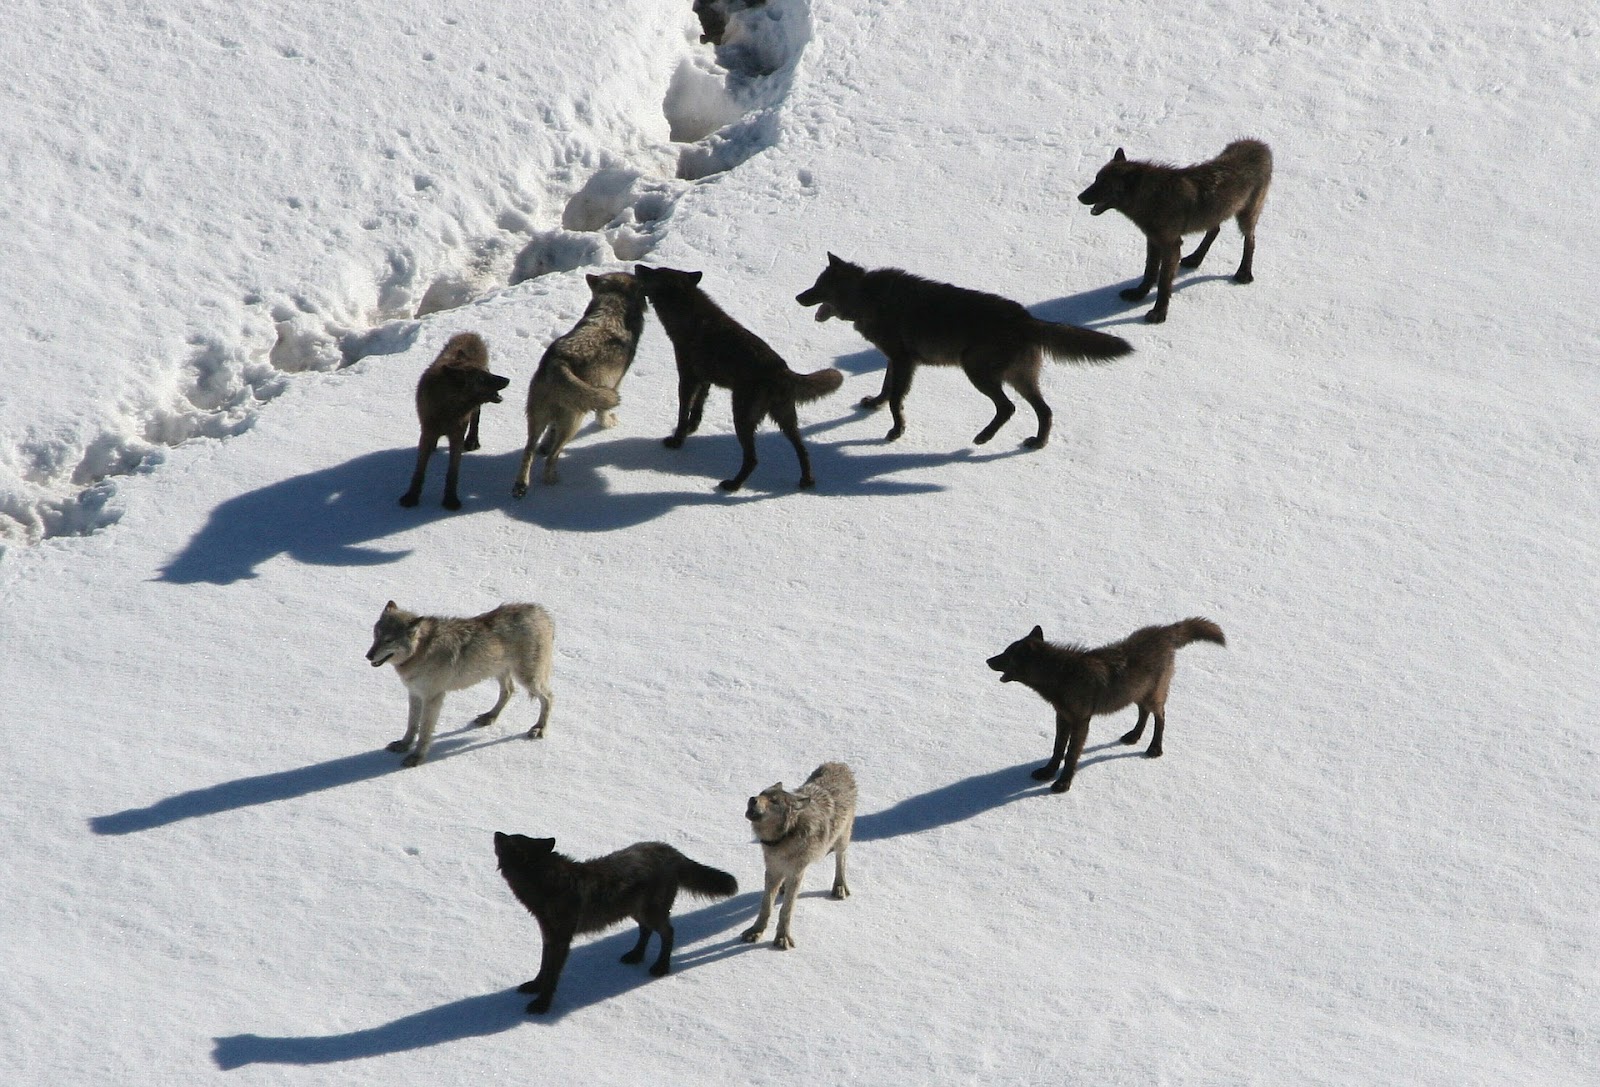
While there are many types of small animals on the island, and almost 20 types of mammals, only two species of the mammals that live on the island are relatively large. These are the wolves and the moose. On this island, wolves are the only predator of moose, and moose are essentially the only food for wolves.
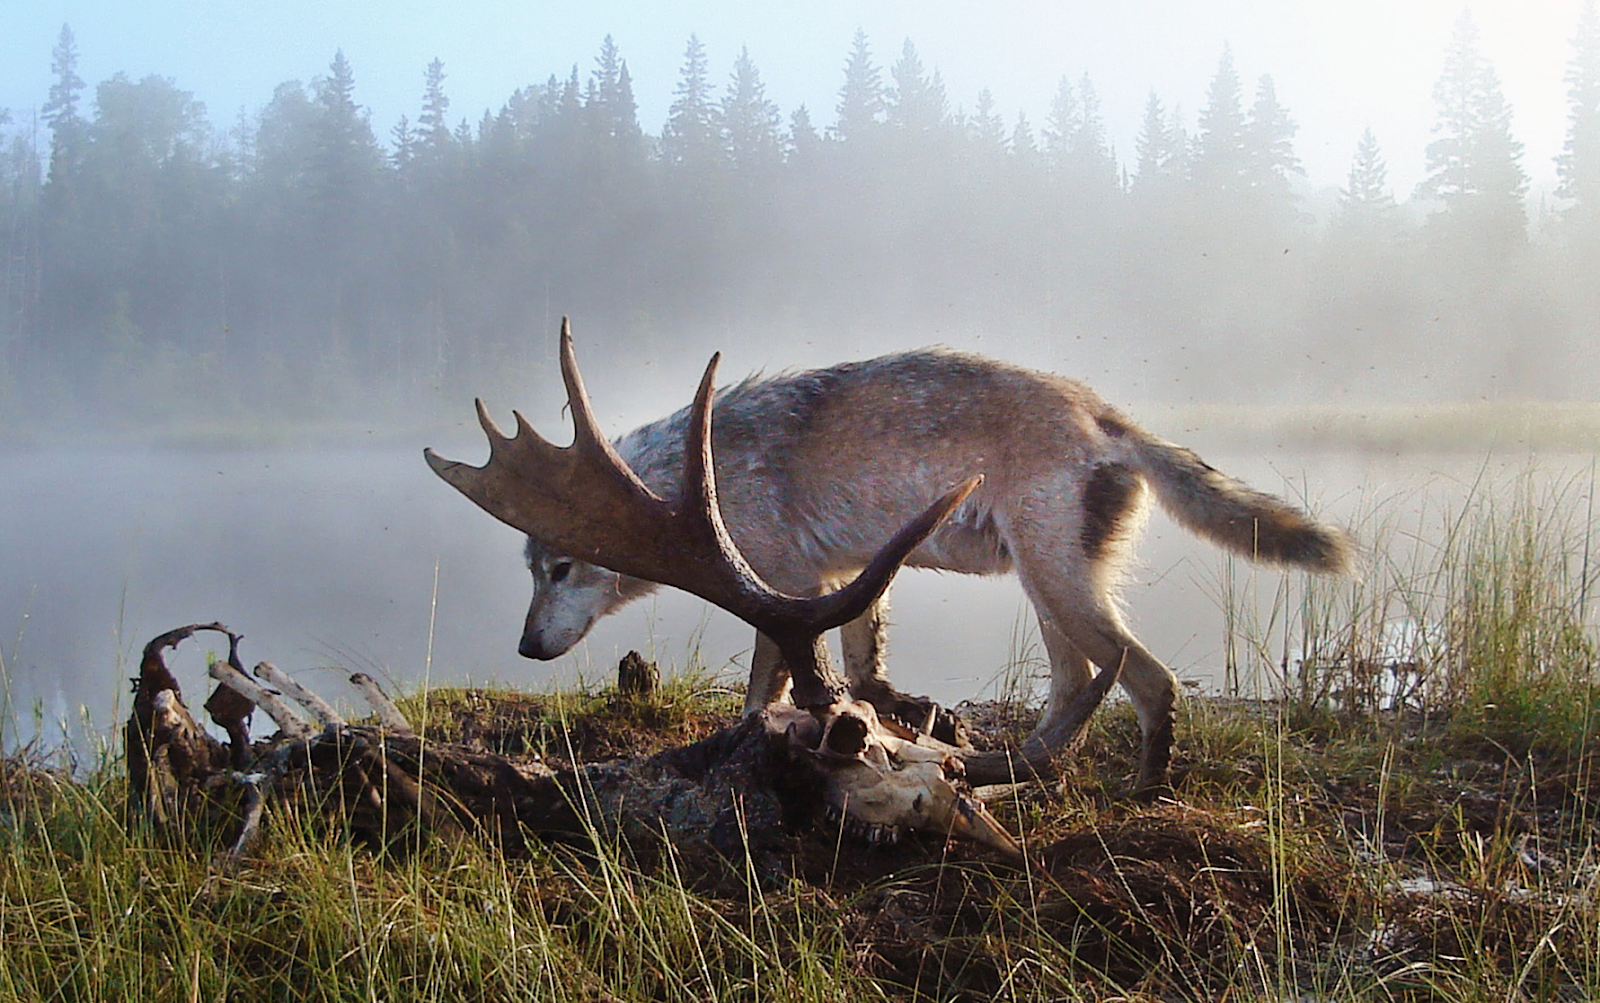
To understand nature, it helps to observe an ecosystem where human impact is limited. On Isle Royale, there are no towns and people do not hunt wolves or moose or cut the forest. It is a very rare place on the planet where wolves, their prey, and the plants that support the prey are all left unharvested by humans. Isle Royale is remarkable, because nature runs wild there.
Your challenge will be to build a scientific model that can more realistically simulate the interactions of wolves and moose on Isle Royale, in order to help make predictions about how these two populations may change over time.
Question 1.1.1
Yes
No
No
Question 1.1.2
Do you believe that the size of the wolf population will change from one month to the next?
Yes
No
No
Question 1.1.3
Do you believe that the size of the wolf population will change over the course of 30 years?
Yes
No
No
Question 1.1.4
Since moose can’t typically migrate on or off the island, what other factors might cause the size of the moose population to change from year to year?
Question 1.1.5
Describe what may cause changes in the population of wolves and moose over time.
1.2. Getting the Wolf to Move
- Scroll down the page and interact with the setup and go (play) button.
- Drag blocks over to tell the wolf and moose how to behave. Anytime you make changes click on the "recompile" button followed by setup and go (play).
- Blocks can be used multiple times.
- Blocks can be dragged to the trash to take them out of the code.
Challenges:
- Get the wolf to move around the field.
- Get the wolf to move around the field more realistically.
- Get the wolf to draw a dashed line or another pattern.
Question 1.2.1
Which blocks did you use to make the wolf move around the field? Choose all that apply.
wolf actions
wolf meets moose
forward
left
right
pen down
pen up
wolf meets moose
forward
left
right
pen down
pen up
Question 1.2.2
Does the wolf look like it’s walking around the whole field or is it just going in a straight line or circles? If the moose aren't moving does the wolf get to all of them over time? Choose all that apply. Hint: Use the pen down block to have the wolf mark it's path.
The wolf is moving around in circles.
The wolf is moving in a straight line.
The wolf is only moving around on some of the field.
The wolf is moving around the whole field realistically.
The wolf isn't moving.
The wolf is moving in a straight line.
The wolf is only moving around on some of the field.
The wolf is moving around the whole field realistically.
The wolf isn't moving.
Question 1.2.3
After you have gotten your wolf moving, spend time trying to figure out the best block combination needed to get more realistic wolf movement. Try changing the numbers found in some of the blocks. What is your ideal block combination for movement.
Question 1.2.4
What blocks did you use to get the wolf to draw a dashed line?
wolf actions
wolf meets moose
forward
left
right
pen down
pen up
hatch
die
ask nearby moose
chance
wolf meets moose
forward
left
right
pen down
pen up
hatch
die
ask nearby moose
chance
Question 1.2.5
What other types of behavior blocks would you add to make this a more realistic wolf and moose predator/prey model?
1.3. Making the Model More Realistic
The poor defenseless moose should be allowed to move as well. Let's see how we can make this a more realistic model. Start by setting up realistic movement for both wolf and moose and then move on from there.
Challenges:
- Wolves and moose move around the field in a realistic way.
- Make the wolf appear to eat a moose when it runs into one.
- Make the moose slowly multiply.
- Come up with a challenge of your own!
Question 1.3.1
Which blocks did you use to make the wolf eat the moose? Choose all that apply.
wolf actions
wolf meets moose
forward
left
right
pen down
pen up
reproduce
die
ask nearby moose
maybe
wolf meets moose
forward
left
right
pen down
pen up
reproduce
die
ask nearby moose
maybe
Question 1.3.2
Which blocks did you use to make the moose multiply? Choose all that apply.
wolf actions
wolf meets moose
forward
left
right
pen down
pen up
reproduce
die
ask nearby moose
maybe
wolf meets moose
forward
left
right
pen down
pen up
reproduce
die
ask nearby moose
maybe
Question 1.3.3
What block(s) did you use to slow down the moose reproduction?
wolf actions
wolf meets moose
forward
left
right
pen down
pen up
reproduce
die
ask nearby moose
maybe
wolf meets moose
forward
left
right
pen down
pen up
reproduce
die
ask nearby moose
maybe
Question 1.3.4
What other blocks would you add to this model to help make it more realistic?
Question 1.3.5
Describe the challenge that you created.
Lesson 2 Overview
In this lesson students explore and learn the text-based (NetLogo) code behind the coding NetTango blocks.
Lesson 2 Activities
- 2.1. Analyzing the code behind the blocks
- 2.2. Transforming the Ecosystem
- 2.3. Wrap Up
2.0. Student Directions and Resources
In this lesson you will take a closer look at the underlying code that is generated when you drag the blocks. You will see that there are some parts of the code that are outside of the blocks, but are needed to get the model up and running.
2.1. Analyzing the code behind the blocks
Now we will look at the computer code produced from your blocks.
- Scroll down and click on the triangle next to "NetLogo Code"
- Set up the blocks that you used before to have the wolf move around.
- Look at the code that is generated when you recompile.
- Answer the questions below.
Question 2.1.1
Look through the text-based code in the NetLogo code part. What is the copyright year?
Question 2.1.2
Examine the text-based code carefully. What is the size of a wolf?
1
2
3
4
5
6
7
8
9
10
2
3
4
5
6
7
8
9
10
Question 2.1.3
Can you find in the code the maximum number of moose that will be allowed in the model?
1
10
100
1000
10000
100000
1000000
10
100
1000
10000
100000
1000000
Question 2.1.4
Challenge: According to the code, what will happen "if" there are more than the maximum number of moose?
2.2. Transforming the Ecosystem
Now that you have a more realistic model of wolves and moose, what can you transform to make it more interesting?
Here are a couple of ideas:
1. Try to make it even more realistic
2. Try to change to an extremely alien ecosystem
Challenge:
Use any combinations of blocks below to make your own world of wolves and moose. Explain your process below.
Question 2.2.1
Describe your transformed world and what changes you made.
Question 2.2.2
Copy and paste the text-based NetLogo code produced in your model below.
2.3. Wrap Up
Question 2.3.1
Do you think that scientists could use a model like this to study a simple ecosystem?
Yes
No
No
Question 2.3.2
Explain your answer to the previous question.
Question 2.3.3
What is one big idea that you have discovered in this lesson?
Question 2.3.4
What is the benefit of using block-based coding like this NetTango model compared to what you normally think about with coding?
Question 2.3.5
What other blocks would you want to add to this model?
Lesson 3 Overview
In this unit, students transition to text-based coding to build a computational model of a simple ecosystem involving wolves and moose based on Isle Royale National Park. They later evaluate this model using real data from the Isle Royale ecosystem and use it to make predictions about the future of the island.
Lesson 3 Activities
- 3.1. Moving from NetTango to NetLogo
- 3.2. Zooming out
- 3.3. Transforming the World Part 2
3.0. Student Directions and Resources
In this unit you will build a computer model of a simple ecosystem involving wolves and moose based on Isle Royale National Park. You will later evaluate that model using real data from the Isle Royale ecosystem and use it to make predictions about the future of the island.
3.1. Moving from NetTango to NetLogo
We will transfer the code that you generated in NetTango to the new NetLogo model. This will give us the basic functions that you worked on before but allow us to make more direct changes. If you need help with any of the steps listed below, click here to see a video of the process.
1. Set up a model similar to the one you completed in the earlier lesson using NetTango. Make sure you click "Recompile" after you finish making changes.
2. Scroll down and click on the 'NetLogo Code' arrow below the block areas to see the full code of the first model written out. Select all of this code and copy it.
3. Scroll down to the second model lower on the page. These instructions will continue below.
4. Click the "NetLogo Code" button in the second model and paste the code there.
5. Click the "Recompile Code" button in the second model.
6. Click setup and go in the second model.
7. Answer the questions below.
Question 3.1.1
After you transferred the code to NetLogo and clicked setup and start, does the model look the same as the NetTango version?
Identical
A little different
Very different
A little different
Very different
Question 3.1.2
The wolves and moose can be transformed into other shapes or organisms. Go to the 'set shape' line for wolves and change the shape for a wolf to a star. Find 5 other shapes (for example, geometric shapes, other animals or plants, or vehicles) that you can change the wolves or moose into and list them below. Remember to always click on the "recompile code" button after making changes.
Question 3.1.3
What else can you change in the model by changing the code?
3.2. Zooming out
Right now, our ecosystem is very small, with only a handful of moose and wolves. In order for it to be more useful for studying places like Isle Royale, we need to make the ecosystem bigger. Open the NetLogo code tab and make the changes need to transform your basic NetTango model into a model that shows interactions on much wider scale.
Question 3.2.1
To make this ecosystem more realistic, we need there to be more animals in it. Try to make the model start with 20 wolves and 100 moose. How did you change the number of wolves or moose that start off the model?
Question 3.2.2
When there are a lot of animals, it is hard to see them all when they are so big. Try to make the wolves and moose smaller. How did you change the size of the wolves and the moose?
Question 3.2.3
Why do you think having a bigger ecosystem is important for studying wolf and moose populations?
3.3. Transforming the World Part 2
Before we work with a more realistic model of wolves and moose, go ahead and mess around again and create your own world? Although this time you will make your changes directly in the code. Don't forget to click the "recompile code" button after you make your changes.
Explain your process below.
Question 3.3.1
Describe the changes you made to transform your world.
Question 3.3.2
Copy and paste the NetLogo code produced in your model below.
Question 3.3.3
What do you like working with more, the blocks or directly with the code?
Blocks
Code
Code
Question 3.3.4
Explain why you chose the previous answer.
Lesson 4 Overview
In previous lessons in this unit, students have built up a model of a simple ecosystem based mainly on their intuitions about how individual animals would behave. In this lesson they will use this model in several ways. First, they will look at how that model is able to produce interesting patterns at the population level, even though this was not an intentional part of the process of building the model. Second, they will think about what it means for a model to be good, and see how they can evaluate their model by comparing its results to real data from Isle Royale.
Lesson 4 Activities
- 4.1. Updating our Isle Royale Predictions
- 4.2. Isle Royale Model
- 4.3. Comparing With Real Data
4.0. Student Directions and Resources
In this lesson, you will look at a version of the model you have been building in the earlier lessons. You will evaluate the accuracy of the model based on data from the real world.
4.1. Updating our Isle Royale Predictions
In this lesson we will look at the wolf and moose ecosystem on Isle Royale again. In an earlier lesson, you thought about why the numbers of wolves and moose might change over time. Now, we will make more predictions about this ecosystem.
Look at this table showing the wolf and moose population sizes in 2011 and answer the questions below.
| Population Size | |
|---|---|
| Wolves | 16 |
| Moose | 515 |
Question 4.1.1
Do you think the number of wolves will increase, decrease, or stay the same in the future?
Increase
Decrease
Stay the same
Decrease
Stay the same
Question 4.1.2
Do you think the number of moose will increase, decrease, or stay the same in the future?
Increase
Decrease
Stay the same
Decrease
Stay the same
Question 4.1.3
Are you confident in your predictions? Why or why not?
Question 4.1.4
How do you think we could test predictions like these?
4.2. Isle Royale Model
In earlier lessons, we tried to think about how a wolf or a moose might behave in the wild. We also thought about how the populations of wolves and moose might change on Isle Royale. You have used this to build a model ecosystem, but we don't know how good of a model it is yet. In this activity we will try to figure that out.
The model below is very similar to the model you have been working with in earlier lessons. The wolves and moose follow all of the same rules as before, except that now there are plants for the moose to eat. If the wolves or moose don't eat enough food, they will die. Look at how the size of the populations changes over time.
We have also added sliders to the model that allow you to change parts of the code without having to go back into the code tab.
Question 4.2.1
Run the model and look at the graph. What do the different parts of the graph represent?
Question 4.2.2
What do you notice about how the number of wolves and the number of moose compare? For example, when one group is large, how big is the other one? When the size of one group changes, how does the other one change?
Question 4.2.3
How do these patterns in the graph change when you change the inputs on different sliders?
Question 4.2.4
Do you think the size of the wolf and moose populations on Isle Royale would actually increase and decrease like they do in this model? Why or why not?
4.3. Comparing With Real Data
Scientists have studied the wolf and moose populations on Isle Royale for decades. This means we have detailed data on how these populations have changed over time. We can see how good our model is by comparing it with these data. When a scientist ran the model from the last activity with the default settings, they got the graph on the left. The data from Isle Royale is on the right.

Question 4.3.1
How is the graph from the model similar to the graph of real population sizes?
Question 4.3.2
How is the graph from the model different from the graph of real population sizes?
Question 4.3.3
Based on this comparison, how good do you think our model is?
Very good
OK
Not good
OK
Not good
Question 4.3.4
Explain your answer.
Lesson 5 Overview
A major point of the previous lesson was to show students how to evaluate whether a model is a good one. They should have found that their model is pretty good at matching what scientists see on Isle Royale. Based on this confidence in the accuracy of their model, they will now use it to make predictions about the future of Isle Royale and the effects of different potential conservation efforts.
Lesson 5 Activities
- 5.1. The Future of Isle Royale
- 5.2. Testing Conservation Strategies
- 5.3. Wrapping Up
5.0. Student Directions and Resources
In the last lesson, you saw that your ecosystem model matches the real world pretty well. Now that we have some confidence in it, we will try to use this model to make predictions about the future of Isle Royale.
5.1. The Future of Isle Royale
Recently the Isle Royale ecosystem has been suffering. Since it has been isolated for a long time, inbreeding has made the wolves less healthy. Also, there are very few wolves left on the island even though there are a lot of moose. We can use our model to try to predict the future of Isle Royale.
First we need to set the model up so that it starts close to the current state of the island. There are very few wolves left and a lot of moose, so set the initial wolf population to 2 and set the initial moose population to about 200. Because the wolves are unhealthy, decrease the WOLF-GAIN-FROM-FOOD slider from 20 to 13 and decrease the WOLF-REPRODUCE slider from 5% to 3%.
Answer the first two questions below before running the model.
Question 5.1.1
Based on what you saw yesterday, why do you think there are so many moose in the ecosystem right now?
Question 5.1.2
Before running the model, make a prediction. Do you think the wolf population will survive, or will it die out?
It will usually survive
It will usually die out
It will usually die out
Question 5.1.3
Run the model with the speed slider all the way to the right. The model will stop after 500 ticks have passed. When the model stops, use the table below to record whether there are still wolves alive or not. Repeat this process at least 5 times.
Question 5.1.4
Look at the results of your experiment. Do you think the wolves on the real Isle Royale have a good chance of surviving into the future? Explain your answer.
5.2. Testing Conservation Strategies
Many scientists think that the wolf population on Isle Royale will probably die out in the near future. However, it may be possible to save them through some human intervention. We can use our model to test how good different interventions might be.
Answer the first two questions below before you start using the model.
Question 5.2.1
What do you think could we do on Isle Royale to increase the chances that the wolves will survive?
Question 5.2.2
How could you make the change you suggested happen in the model? For example, what parameters would you change? How would you change them?
Question 5.2.3
Make the change or changes you suggested in the model and test how often the wolves survive. Fill out the table below.
Question 5.2.4
Do you think your intervention worked? Explain your answer.
5.3. Wrapping Up
Question 5.3.1
Give an example of how a scientist might use a NetLogo model to study ecosystems. Think of something specific a scientist might want to learn by using a model like this.
Question 5.3.2
Models are useful tools for scientists, but no model can do everything. Why might it be hard to use a model like this to study ecosystems?
Question 5.3.3
What is one big idea you have discovered from these lessons?
