How many total traffic stops do you think that EPD made in the 6.75 months between 1/1/20 and 7/23/20? I realize you have no great way of knowing, take a guess!
Overview
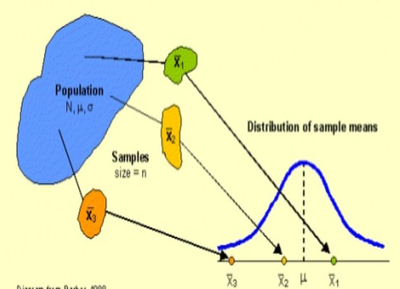
When we want information about the population proportion of successes, we often take a simple random sample and use the sample proportion to estimate the unknown parameter . The sampling distribution of the sample proportion describes how the statistic varies in all possible samples of the same size from the population. In this lesson, students will explore the shape and variability of this distribution, and learn how to evaluate claims using the sampling distribution.
Standards
Computational Thinking in STEM 2.0
- Computational Data Practices
- [CT-DATA-1] Using computation to collect and create data
- [CT-DATA-6] Using computation to analyze data
- Computational Modeling and Simulation Practices
- [CT-MODEL-1] Using computational models to understand a complex phenomenon
- [CT-MODEL-2] Using computational models to hypothesize and test predictions
Activities
- 1. Thinking about our Context
- 2. Introducing our Context
- 3. Apply - evaluate claims using the sampling distribution
- 4. Introduction to sampling from 2 populations
- 5. Setting up for 2 samples
- 6. Carrying out the 2 Samples and calculating the difference in sample proportions
- 7. Formulas and Calculations
- 8. Reminder about the need to collect and analyze statistics
- 9. Practice with 2 proportions
Student Directions and Resources
Students will be able to:
- Calculate and interpret the mean and standard deviation of the sampling distribution of a sample proportion \(\hat p\)
- Determine if the sampling distribution of \(\hat p\) is approximately Normal
- Calculate and interpret the mean and standard deviation of the sampling distribution for a difference in sample proportions, \(\hat p_1 - \hat p_2\)
- Determine if the sampling distribution of a difference in proportions, \(\hat p_1 - \hat p_2\) , is approximately Normal
- Use a Normal distribution to calculate probabilities involving \(\hat p\) and \(\hat p_1 - \hat p_2\)
1. Thinking about our Context
One thing that police do is make traffic stops. There are many different reasons that the police might choose to pull someone over and in some cases give the driver a ticket. Is their decision affected by gender? race? socio-economic status? time of day? type of car? Statistics is one way to answer these questions but it can also be used to purposely mislead people about the answers to these questions.
"There are three types of lies - lies, damn lies, and statistics" (attributed to Mark Twain, maybe aprocryphal)
We’re going to look at some Evanston Police Department (EPD) data about traffic stops between 1/1/2020 and 7/23/2020 and try to come up with some truthful answers.
Question 1.1
2. Introducing our Context
Here is the data, there were 22687 total traffic stops as reported by EPD. There are lots of different questions that we might want to answer based off of this data. As you know, over the past many years Police Departments have been under scrutiny for how they treat people of color, specifically black people. In the Summer of 2020, the murder of George Floyd at the hands of the police was the latest in a string of innocent black lives lost in their interactions with police (https://www.bbc.com/news/world-us-canada-52905408). The ensuing protests and the Black Lives Matter Movement have put police treatment of black Americans in the spotlight. For that reason, we will specifically focus on data about traffic stops of black drivers throughout this lesson. Let's take a look at Data from Evanston. Clearly this could be an issue for any race, or gender, or a lot of other things, but for the purpose of this lesson we'll focus specifically on black vs. non-black drivers in Evanston.
Remember, this is traffic stops by EPD from 1/1/20 - 7/23/20 broken down by race.
| Race | Number |
| White | 12407 |
| Black | 6887 |
| Hispanic | 1784 |
| Asian | 1465 |
| Unknown | 144 |
| Total | 22687 |
See below for questions and instructions.
Question 2.1
Someone looks at this data and concludes that EPD is biased against white people. Do you agree? How would you use this data to support or refute their claim?
Question 2.2
What other information do you think is needed in order to investigate the idea that EPD is disproportionately stopping one race of driver?
Question 2.3
Calculate the proportion of traffic stops in which the driver was black.
Question 2.4
Set the population proportion slider to match your answer in the previous question. When you click "setup" button and then the “take sample” button the model will take an SRS of 5 traffic stops and report the proportion of drivers who identify as black. Take a few samples. Do you get proportions close to the actual value? Explain why you do or do not.
Question 2.5
On the next page you're going to do some work with sampling distributions. Define the term "sampling distribution" in one sentence.
Question 2.6
Before we get too deep into this, let's acknowledge that this is a very complicated issue. The how and why of traffic stops is complicated. Understanding that there are no right answers, what are some possible problems that exist with this data before we do anything to it?
3. Apply - evaluate claims using the sampling distribution
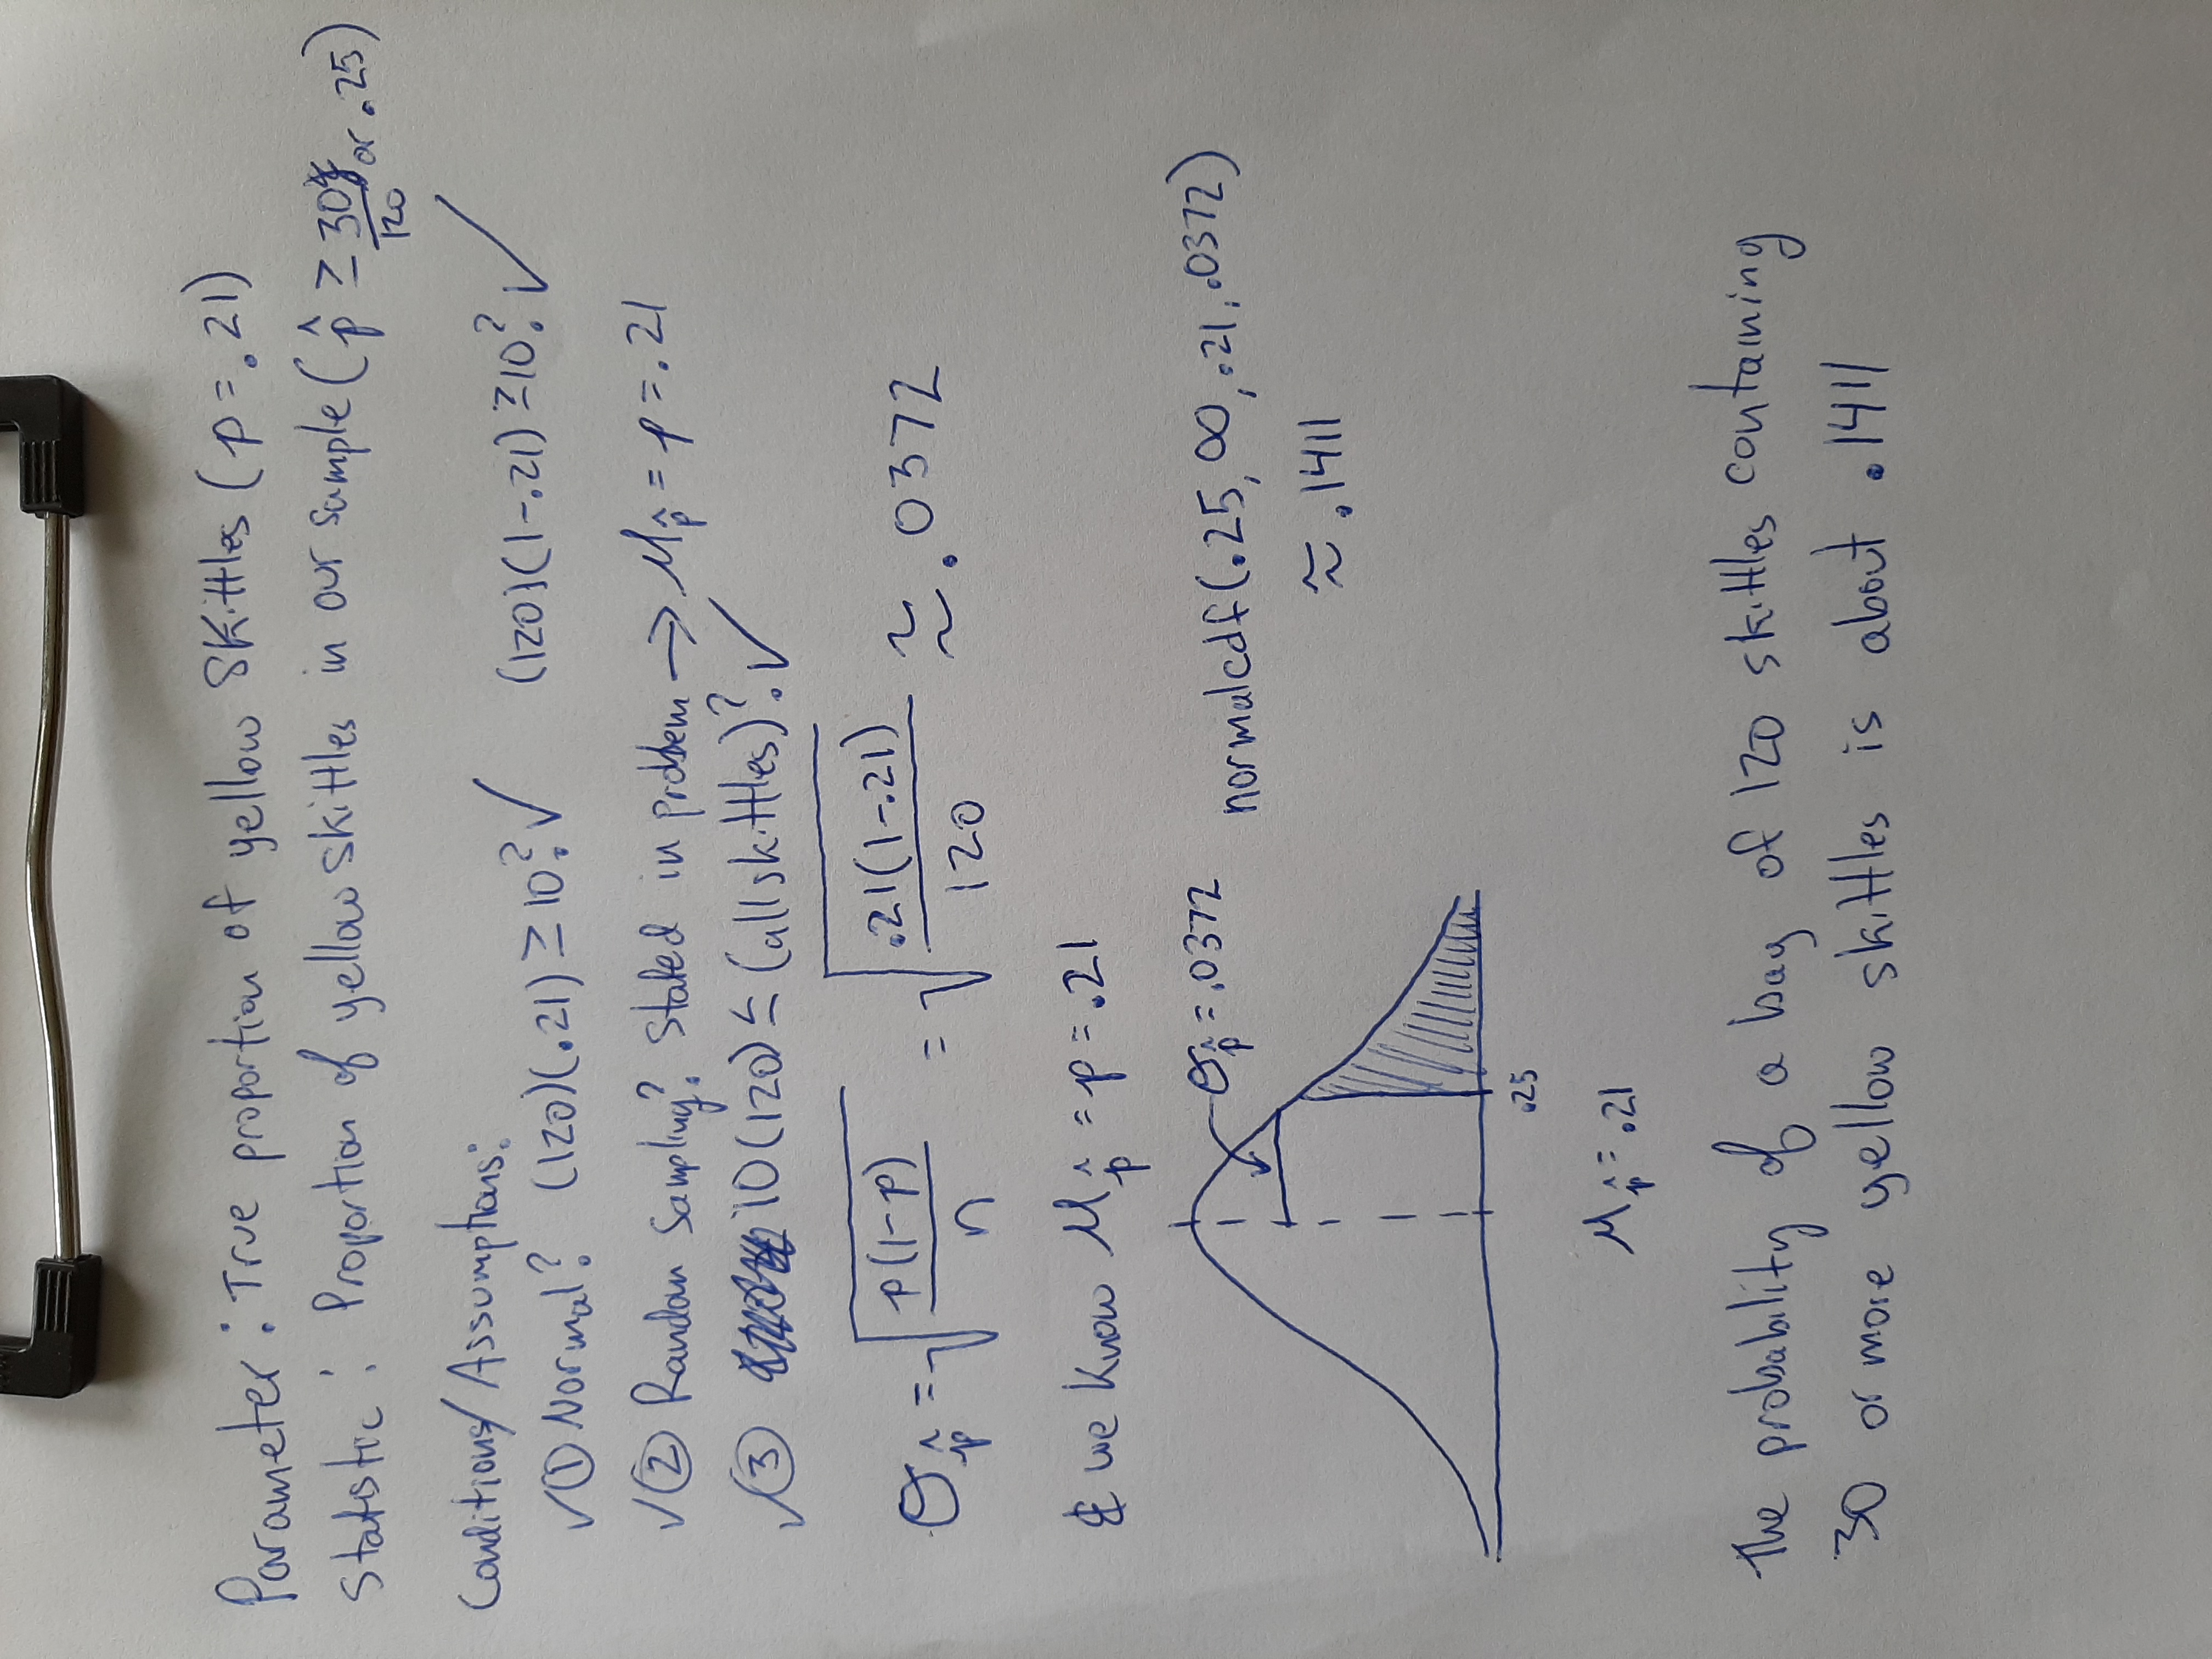
Below are a few additional questions related to sampling distributions for proportions. These are the sorts of questions that you'll be expected to answer on an AP test. Be sure to check all necessary conditions and show all work. Do your work on paper and upload a scanned image for the questions below. See the example below for what an exemplary response looks like for these types of problems.
Example problem and solution: Suppose it is known that 21% of all Skittles produced are yellow. We will also assume that every bag of Skittles is a simple random sample from that entire population. Suppose you purchase a bag containing 120 Skittles. What is the probability of that bag containing 30 or more yellow Skittles?
Question 3.1
In a congressional district, 55% of registered voters are Democrats. Suppose we take a random sample of 100 voters from this congressional district. What is the probability of getting less than 50% Democrats in a random sample of size 100?
Upload files that are less than 5MB in size.
| File | Delete |
|---|---|
Upload files to the space allocated by your teacher.
Question 3.2
In July 2020, the Chicago Tribune asked a random sample of 750 Chicago residents. "Do you wear a face covering in public?" Based on a previous study by the IDPH, we know that 50% of ALL Chicago residents actually wear a face covering in public. Let \(\hat p\) be the sample proportion who say that they wear a face covering in public. What is the probability that, in a random sample of 750, more than 75% will respond "Yes (I wear a face covering in public)"?
Upload files that are less than 5MB in size.
| File | Delete |
|---|---|
Upload files to the space allocated by your teacher.
4. Introduction to sampling from 2 populations
We're coming back to our EPD data. A newspaper article claims that the proportion of traffic stops for black residents in Evanston (p1) is HIGHER than the proportion of black residents in Evanston (p2).
Question 4.1
If the claim is true what could that suggest about racial bias in EPD?
Question 4.2
The idea that Police aren't always fair in carrying out their duties can bring up a lot of feelings and experiences. Do you have any personal thoughts or experiences about this topic that you'd like to share?
Question 4.3
What would it mean if p1 = p2?
5. Setting up for 2 samples
We’re lucky that the Evanston Police Department keeps these sorts of records AND makes them available to the public. We don't have to use sampling in order to estimate the proportion of traffic stops that involve black drivers. But this is a lesson about sampling, SO WE'RE GOING TO PRETEND!
Let’s say we didn’t have all the data that we do have, so we HAD to use random sampling in order to investigate. For the remainder of this lesson, we’re going to pretend that we don’t have the full data, and we’re going to generate random samples in order to simulate real-world sampling.
We’re going to have to use sampling to estimate two different proportions:
1. The proportion of all traffic stops that are of black drivers
2. The proportion of Evanston residents who are black
There are a total of 72,836 residents in Evanston and 22,687 traffic stops made.
Question 5.1
Using our omnipotence, we believe that the proportion of black drivers stopped in traffic stops is about 30%. What is the largest sample size you could use to estimate the true proportion of black drivers stopped in traffic stops? Show your calculations. What is the smallest sample size you could use? Jot down these numbers as you're going to need it later on!
Question 5.2
Once again, we'll use our omnipotence to guess that the true proportion of black residents in Evanston is about 17%. What is the largest sample you could take from the entire population in Evanston and still meet all of our conditions? What is the smallest sample size you could use? Show calculations. Jot down this number as you're going to need it later on!
Question 5.3
There's something obviously unrealistic in our pretend scenario. In real life we might not have any idea about the true proportions. What do you think you would do in that case? (we'll answer this question in the next chapter!)
6. Carrying out the 2 Samples and calculating the difference in sample proportions
What we really care about here is the DIFFERENCE between our two proportions.
Let p1 be the true proportion of Evanston black drivers stopped in traffic stops.
Let p2 be the true proportion of all black residents in Evanston.
Question 6.1
What does it mean in context if p1 - p2 is POSITIVE?
Question 6.2
What does it mean in context if p1 - p2 is ZERO?
Question 6.3
What does it mean in context if p1 - p2 is NEGATIVE?
7. Formulas and Calculations
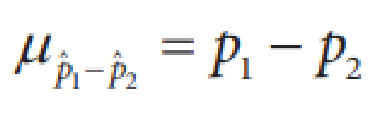
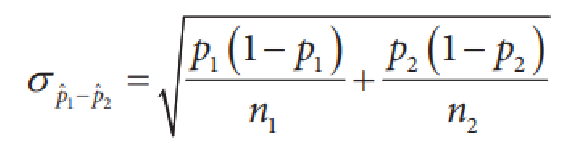
Here are the formulas for the standard deviation and the mean of a difference between two proportions. Use the model, the known population proportions, and the sampling sizes you calculated before to carry out sampling for both proportions. Scroll down for detailed instructions.
Question 7.1
Calculate the mean (\(\mu_{\hat {p_1} - \hat {p_2}}\)) and standard deviation (\(\sigma_{\hat {p_1} - \hat {p_2}}\)). This is the center and spread of our sampling distribution for the difference in proportions.
Question 7.2
Set the population proportion to our actual value for proportion of traffic stops of black drivers (0.30). Set the sample size slider to the number you calculated on page 7 for the smallest allowable sample size. Collect a sample, and record your sample proportion (\(\hat p_1\)) here.
Question 7.3
Set the population proportion to our actual value for proportion of black resisdents in Evanston (0.17). Set the sample size slider to the number you calculated on page 7 for the smallest allowable sample size. Collect a sample, and record your sample proportion (\(\hat p_2\)) here.
Question 7.4
What conclusion(s) would you draw BASED ON YOUR DATA? (We would like you to draw a conclusion about the population from your sample results, using the Normal distribution)
8. Reminder about the need to collect and analyze statistics
Here's the real values for p1 and p2.
p1=0.3057
p2=0.17
Question 8.1
Calculate the value of \(p_1 - p_2\)
Question 8.2
Explain what this difference in proportions means in real life, in a way that any high school student could understand.
Question 8.3
How close was your estimate based on random sampling?
Question 8.4
We've been pretending that we didn't have all of the data, so we had to use random sampling in order to estimate our population proportions. Explain why in real life we would NEED to use random sampling to do a similar analysis in a different situation.
Question 8.5
Based on this data it seems that black drivers are disproportionately pulled over in Evanston. How do you feel about that?
Question 8.6
What additional data could we use to explore this issue more deeply?
and/Or
What are some things that we could do to begin to address this?
and/Or
What are some other questions that we could investigate using this (or other) data?
9. Practice with 2 proportions
Suppose we want to investigate the effectiveness of two potential COVID-19 vaccines. We will call these "Vaccine 1" and "Vaccine 2".
During Phase 3 trials of the vaccine development process, thousands of volunteers are randomly assigned one of the two vaccines. After 30 days, researchers take blood samples to detect if antibodies are present. The presence of antibodies would indicate that the vaccine has been effective at preventing the individual from experiencing moderate to severe COVID-19 symptoms. The table below shows the results of some randomly selected volunteers from each vaccine trial.
| Antibodies present | No antibodies present | |
| Vaccine 1 | 53 | 22 |
| Vaccine 2 | 59 | 16 |
Question 9.1
Identify each of the following, using the table above : \(n_1, n_2, \hat p_1, \hat p_2\)
Question 9.2
Based on the sample results, which vaccine seems to be more effective? Provide evidence to support your reasoning.
Question 9.3
Let's analyze the difference between these two sample proportions. Calculate \(\hat p_1 - \hat p_2\)
Question 9.4
For the standard deviation formula, we need to think back to our work with combining random variables in Chapter 6. Remember: you have a formula for the standard deviation of \(\hat p_1 - \hat p_2\) on your formula sheet!
Calculate this value for our scenario using your answers from question 8.1
Question 9.5
Later on, we found out that the two vaccines are equally effective. What is the probability of observing a difference in sample proportions greater than the one shown in the table? Be sure to check the Normal condition for each population.
