Question 1: What do you observe when green leakage channels are added to the membrane?
Overview
The activity focuses on student understanding of the biology concept of passive diffusion. Each activity is divided into three main CT activities: 1) recording observations and gathering data and 2) analyzing data and 3) testing different simulation scenarios to understand a problem.
Standards
Next Generation Science Standards
- Life Science
- [HS-LS1] From Molecules to Organisms: Structures and Processes
Computational Thinking in STEM
- Data Practices
- Analyzing Data
- Collecting Data
- Creating Data
- Visualizing Data
- Modeling and Simulation Practices
- Using Computational Models to Find and Test Solutions
- Using Computational Models to Understand a Concept
- Computational Problem Solving Practices
- Assessing Different Approaches/Solutions to a Problem
- Systems Thinking Practices
- Understanding the Relationships within a System
Activities
- 1. Transport through Cell Membranes Introduction
- 2. Setting up the model
- 3. Activity 2: Selective Diffusion
- 4. Exploration 1:
- 5. Exploration 1: Understanding how concentration gradient affects rate of facilitated diffusion
- 6. Exploration 2: Understanding how number of protein channels affect rate of diffusion
- 7. Activity 3 (Graphs)
Student Directions and Resources
You will need the following resources to complete this assignment.
1. Transport through Cell Membranes Introduction
The net movement of molecules from an area of high concentration to an area of low concentration is called diffusion. In a liquid, a solute (dissolved molecules) will diffuse in a solvent (dissolving agent, most often water in biological systems) and eventually become uniformly distributed throughout the solution.
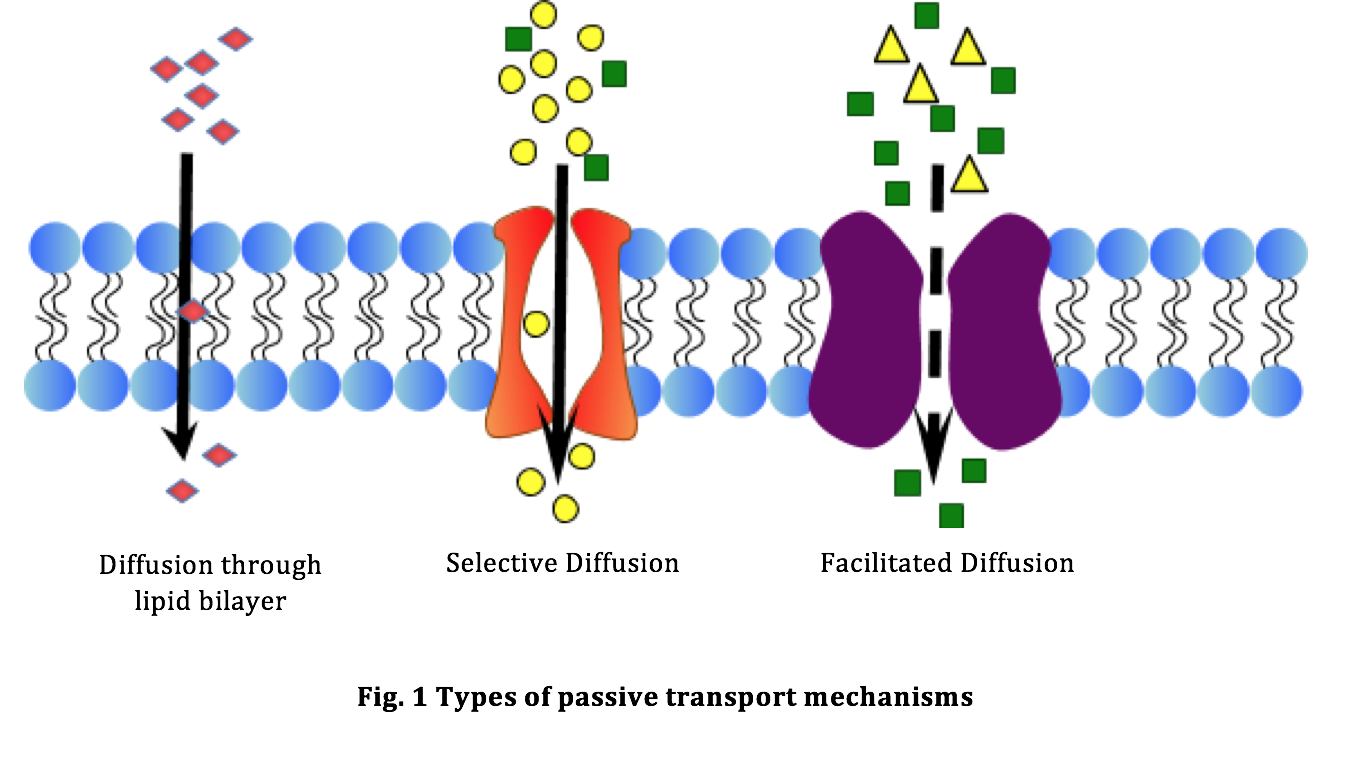
In the context of a cell, diffusion of a substance, such as molecules and ions, happens across the cell membrane and continues until equilibrium is reached. At the point of equilibrium, the concentration of the substance is same on either side of the membrane. As this is a spontaneous process requiring no input of energy, it is also referred to as passive diffusion. The cell takes in nutrients like glucose, ions and water and eliminates wastes through the cell membrane. Cell membranes are composed of phospholipids and a variety of proteins. Many of these proteins form selective channels that help move material across the cell membrane, for example glucose ions and ATP. Cell membranes are selectively permeable, meaning that some substances can pass across them and others cannot. The cell membrane’s ability to permit the exchange of gases or water molecules is called permeability. Fig. 1 illustrates the types of passive transport mechanisms.
Diffusion of water through a selectively permeable membrane is called osmosis. Unlike many other substances, water molecules do not require protein channels to move across the membrane but diffuse through the lipid bilayer. The direction of net movement of water depends on the concentration of solute inside and outside the cell, that is, whether the cell’s environment is isotonic, hypotonic, or hypertonic. Figs. 2a, 2b and 2c show the effect of different environment on human red blood cells. The first image in Fig. 2a shows the red blood cells depleted of water. This happens when concentration of solute is greater outside the cell and the concentration of water outside is correspondingly lower. As a result, water inside the cell flows outwards to attain equilibrium, causing the cell to shrink. The second image shows appearance of red blood cells in isotonic environment where the concentration of solute is equal on either side of the membrane. In this case, the movement of water into the cell balances the movement of water out of the cell and the cell retains its donut like shape. Cells in the third image in Fig. 2a appear to be swollen because of the low concentration of solutes outside the cell compared to inside the cell. In an attempt to balance the concentrations of solutes across the cell membrane, water will rush into the cell, causing it to swell and possibly burst. Fig 2b shows how the red blood cells actually look like when observed under a microscope.


Red blood cell membranes are characterized by internal channels that allow glucose molecules to pass through them. Because these channels are selective in their transport, only glucose can pass through and can move in either direction. The membrane protein channel is said to facilitate, or help the diffusion of glucose across the membrane. This process, shown in Fig. 1 is called facilitated diffusion. Although facilitated diffusion is fast and specific, a net movement of molecules across a cell membrane will occur only if there is a higher concentration of the particular molecules on one side than the other side.
Depending upon the material, diffusion across the membrane happens through either ‘leakage channels’, or ‘gated channels’. Leakage channels are always open, while gated channels open in response to some stimulus (ion concentration or light).
In the red blood cells, a specific protein that spans the membrane has an internal channel that allows glucose to pass right through it. Only glucose can pass through this channel, and it can move in either direction. Fig. 3 below shows the presence of these protein channels when observed in florescent light under a microscope.

This activity will introduce you to an interactive simulation of different ways molecules, such as ions, travel across cell membranes. In this virtual lab, you will be using the ‘Membrane Channels’ model to simulate and visualize the dynamics of simple and facilitated diffusion across a semi-permeable membrane.
2. Setting up the model
A screenshot of the simulation window is shown in Fig. 4. In the simulation, the top half of the blue space is considered the inside of the cell. The bottom half of the blue screen is considered the outside of the cell. The ‘Membrane’ separates the inside of the cell from the outside. The blue diamonds are water molecules and the green circles are solute molecules (sugar, salt, proteins etc.). You can add these to the cell environment by pressing the red buttons on the left. The slider at the bottom of the screen controls the speed of the simulation. ‘Check’ the 'Show Concentration' box to see the concentration of solute and water on either side of the membrane. The concentration of each substance is represented by a color-coded bar. The bar will increase or decrease in length as the simulation progresses, indicating the corresponding change in concentration. This visual representation is also known as a bar graph.

-
Add approximately 20 green circles, which represent molecules, to the inside of the cell. Observe the behavior of the molecules.
-
Pause the simulation.
-
Drag and drop 1-2 “leakage” green channels onto the membrane. Press the start button. Observe.
-
Answer question 1
-
Drag and drop 1-2 “leakage” blue channels onto the membrane.
-
Add 20 blue diamonds to outside of cell membrane.
-
Click on the box next to 'Show Concentration' tab to observe concentration of molecules on each side with help of the bar graph.
-
Let the simulation continue for 2 minutes.
-
Answer question 2
Question 2.1
Question 2.2
Question 2: At the end of 2 minutes, how did the bar graph look like for the blue diamonds and why?
3. Activity 2: Selective Diffusion
The difference in concentration of molecules on either side of the membrane is called a concentration gradient. The concentration gradient is responsible for driving transport of molecules across the semi-permeable cell membrane.
Exploration 1: Understanding how concentration gradient affects rate of selective diffusion
In this exploration, you will observe how the concentration of a particular molecule, for example chloride ions, in the cell affects the rate of diffusion. The effect of presence of different molecules in the cell on the rate of diffusion of another molecule will also be examined.
Setup a simulation where chloride ions diffuse in and out of the cell. In this exercise, chloride ions will be represented by green circles. Press the “reset all” button to remove all of the molecules and channels.
1. Add 20 chloride ions inside and 5 chloride ions to the outside of the cell and set the animation speed (by moving the slider at the bottom) at the default speed.
2. Check the box 'SHOW CONCENTRATION'.
Answer Question 3 and 4
3. Click the PAUSE icon (next to the slider) to pause the simulation. Place 2 green leakage channels into the membrane.
4. Observe the bar graph on the right side of the simulation screen.
5. Begin a timer and click the PLAY icon at the same time. Keep observing the bar graph as the simulation progresses.
6. Stop the timer and note the time when you think concentration (the number) of the chloride ions is equal on both sides; that is, when equilibrium is reached.
Answer Question 5:
Earlier in the exploration, you made a hypothesis. You estimated the amount of time it will take to reach equilibrium by observing the bar graph. Now, you will use another method.
1. Press the “reset all” button to remove all of the molecules and channels.
2. Add 60 chloride ions (green circles) inside and 15 chloride ions to the outside of the cell and set the animation speed (by moving the slider at the bottom) at 170.
3. Click the PAUSE icon (next to the slider) to pause the simulation. Place 2 green leakage channels into the membrane.
4. Begin a timer for 20 seconds and click the PLAY icon at the same time. After every 20 seconds, pause the simulation and count the number of green circles on each side of the cell membrane. Do this for about 5 minutes. Complete Table 1
5. Press the “reset all” button to remove all of the molecules and channels.
6. Follow the steps mentioned earlier but add 40 chloride ions inside the cell.
7. Begin a timer for 20 seconds and click the PLAY icon at the same time. After every 20 seconds, pause the simulation and count the number of green circles on each side of the cell membrane. Do this for about 5 minutes. Complete Table 2
You will now test if the presence of different molecules in the cell affects the rate of diffusion of a particular molecule. Setup a simulation where a cell contains sodium ions in addition to chloride ions. In the model, blue diamonds will represent sodium ions.
1. Press the “reset all” button to remove all of the molecules and channels.
2. Follow the steps mentioned earlier but add 20 chloride ions (green circles) and 20 sodium ions (blue diamonds) inside the cell.
3. Begin a timer for 20 seconds and click the PLAY icon at the same time. After every 20 seconds, pause the simulation and count the number of green circles on each side of the cell membrane. Do this for about 5 minutes. Complete Table 3
Question 3.1
Question 3: Observe at the bar graph. Which side of the cell has a higher concentration gradient?
Question 3.2
Question 4: How much is the concentration gradient?
Question 3.3
Question 5: How much time is required to achieve equilibrium across the membrane?
Question 3.4
Question 6: From the values you filled in Table 1, can you estimate how much time is required to reach equilibrium? How does this compare with the time value you estimated for Question 5?
4. Exploration 1:
Plot a curve on the graph paper provided to you based on the values entered in Table 1, Table 2 and Table 3 for ‘Time’ on the X-axis and the ‘Number of chloride ions outside the cell’ on the Y-axis.
Question 4.1
Question 7: How does the increase of concentration affect the rate of diffusion? Explain with the help of the curves you plotted.
Question 4.2
Question 8: How does the presence of another type of molecule affect the rate of diffusion? Explain with the help of the curves you plotted.
Question 4.3
Question 9: In the third and last simulation, if the concentration of sodium ions is increased, how will it affect the rate of diffusion of chloride ions?
5. Exploration 1: Understanding how concentration gradient affects rate of facilitated diffusion
Molecules like water and lipids diffuse freely through the cell membrane. However, most molecules cannot diffuse similarly because of their size or electric charge and require protein channels that facilitate their transport across the cell membrane. As shown in Fig. 3, certain types of protein channels present on the surface of red blood cells facilitate the exchange of glucose molecules. Similarly, other types of protein channels facilitate the transport of ATP molecules in and out of the cell. Like glucose, ATP molecules are a source of energy for the cell. Fig. 5A and 5B show how red blood cells look like when observed under a scanning electron microscope.

Fig. 5A shows how red blood cells appear when they are immersed in a solution in which the concentration of ATP is equal on either side of the membrane. In this case, there is adequate ATP for the cell to carry out its functions and the cell is healthy and retains its donut like shape. Fig. 5B shows the red blood cells depleted of ATP. The cell, deprived of energy fails to carry out its functions and loses its shape and it shrinks. Eventually it dies.
In this exploration, you will observe how concentration of glucose molecules affects its rate of diffusion. Setup a simulation where glucose molecules are diffusing into the cell. In this exercise, glucose molecules will be represented by green circles.
1. Press the “reset all” button to remove all of the molecules and channels.
2. Add 5 glucose molecules inside and 20 glucose molecules outside of the cell and set the animation speed (by moving the slider at the bottom) at 170.
3. Check the box 'SHOW CONCENTRATION'.
4. Click the PAUSE icon (next to the slider) to pause the simulation. Place 2 green gated channels into the membrane.
Begin a timer for 20 seconds and click the PLAY icon at the same time. After every 20 seconds, pause the simulation and count the number of green circles on each side of the cell membrane. Do this for about 5 minutes. Complete Table 4
Answer Questions 10 and 11
5. Press the “reset all” button to remove all of the molecules and channels.
6. Follow the steps mentioned earlier but add 40 glucose molecules inside the cell.
7. Begin a timer for 20 seconds and click the PLAY icon at the same time. After every 20 seconds, pause the simulation and count the number of green circles on each side of the cell membrane. Do this for about 3 minutes.
Question 5.1
Question 10: Look at the bar graph. Which side of the cell has a higher concentration gradient?
Question 5.2
Question 11: How much is the concentration gradient?
6. Exploration 2: Understanding how number of protein channels affect rate of diffusion
In addition to concentration gradient, rate of facilitated diffusion also depends on the number of specific carrier protein molecules in the membrane. Considering the previously stated example of diffusion of glucose: No matter how much the cell “needs” the glucose- no matter how great the concentration gradient- the rate at which the glucose can diffuse into the cell has a limit because of the limited number of glucose carrier protein molecules in the lipid bi-layer.
To understand how number of protein channels available for diffusion affect rate of diffusion, again setup the previous simulation where glucose molecules are diffusing into the cell with the help of the carrier proteins present in the cell membrane.
-
Add 5 glucose molecules (green circles) inside the cell. Add 20 glucose molecules outside of the cell.
-
Set the animation speed (by moving the slider at the bottom) at 170.
-
Check the box 'SHOW CONCENTRATION'.
-
Click the PAUSE icon (next to the slider) to pause the simulation. Place 2 green gated channels into the membrane.
-
Begin a timer for 20 seconds and click the PLAY icon at the same time. After every 20 seconds, pause the simulation and count the number of green circles on each side of the cell membrane. Do this for about 3 minutes. Complete Table 6
Complete Table 7 for the previous scenario with glucose molecules having 4 channels for diffusion.
Complete Table 8 for the previous scenario with glucose molecules having 8 channels for diffusion.
From tables 6, 7 and 8 find out how much time was needed in each case to reach equilibrium and fill in table 6. If you have a time range, take the value at the middle of that range as the required time.
7. Activity 3 (Graphs)
Exploration 1
Plot your experimental data as a line graph on the graph paper provided to you based on the values entered in Table 6 and Table 7 for ‘Time’ on the X-axis and the ‘Number of glucose molecules outside the cell’ on the Y-axis.
Exploration 2
Plot a bar graph based on the data values in Table 9. Plot number of gated channels for glucose molecule on the X-axis and the time required for equilibrium on the Y-axis.
Question 7.1
Question 12: How does the increase of concentration affect the rate of diffusion? Give an explanation based on the data that you have plotted.
Question 7.2
Question 13: How would the presence of another molecule, such as ATP, affect diffusion of glucose molecules if ATP molecules and glucose require different channels for transport.
Question 7.3
Question 14: How would the presence of another molecule, such as ATP, affect diffusion of glucose molecules if ATP molecules and glucose use the same channels for transport.
Question 7.4
Question 15: How does the number of channels available affect the rate of diffusion for one type of molecule? Explain with the help of the bar graph that you have plotted.
Question 7.5
Question 16: Will the rate of facilitated diffusion of glucose molecules increase or decrease if there were 12 channels.
Question 7.6
Question 17: Will the rate of facilitated diffusion of glucose molecules increase or decrease if there were 1 channels.
