What is the graph showing us on the y - axis?

Overview
At this time, we have learned much about COVID-19 and its effects. We have learned some of the things that have worked to protect ourselves and others. There are a lot of differing opinions throughout the world and we are left to wonder: Who's right? What's wrong? In this lesson, students will learn how to read the NetLogo graphs and begin to learn the NetLogo language. The NetLogo Model is programmed to clearly represent the effectiveness of masking and social distance. Graphing Practice is provided in Pages 1 and 2. On Page 3, students will have time to experiment with the model.
***The NetLogo graph is interesting to use. There is a zoom feature so the observer can see a moment in time (number of days). There is also an isolation feature so the observer can look at just one result: sick, dead, uninfected, recovered.
Standards
Next Generation Science Standards
- Engineering, Technology, Applications of Science
- [HS-ETS1-1] Analyze a major global challenge to specify qualitative and quantitative criteria and constraints for solutions that account for societal needs and wants.
- NGSS Crosscutting Concept
- Patterns
- Causation
Activities
- 1. Graphing Practice
- 2. Graphing Practice (two plot lines)
- 3. The NetLogo Model
Student Directions and Resources
The NetLogo Model will help us to understand the effects of COVID-19 on the human population. Information is compiled into line graphs that we can use to better understand results. However, we need to know how to read the graph so practice is supplied in this Lesson. Then, in order to understand the model, you will need to understand the NetLogo coding language. Not to worry, this is new for all of us. You will experiment with different parameters within the model to demonstrate what happens when humans practice safety when traveling in a world with COVID-19. Relax and enjoy!
You will need the following resources to complete this assignment.
1. Graphing Practice
In this part of the unit, you will use a different NetLogo model. This model is about the transmission of disease and the social behavior of people.
Let's first understand how to read graphs in the model.

Use the above graph to answer the following questions. Be sure to label your answers.
Question 1.1
Question 1.2
Using the graph, what is the number of sick on day 20?
Question 1.3
Based on what you know on the graph about the number of sick, what does the 40% represent?
Question 1.4
What does the 28 represent on the line graph?
Question 1.5
After day 40, what is the 'trend' in the number of sick? Why do you think this is happening?
2. Graphing Practice (two plot lines)
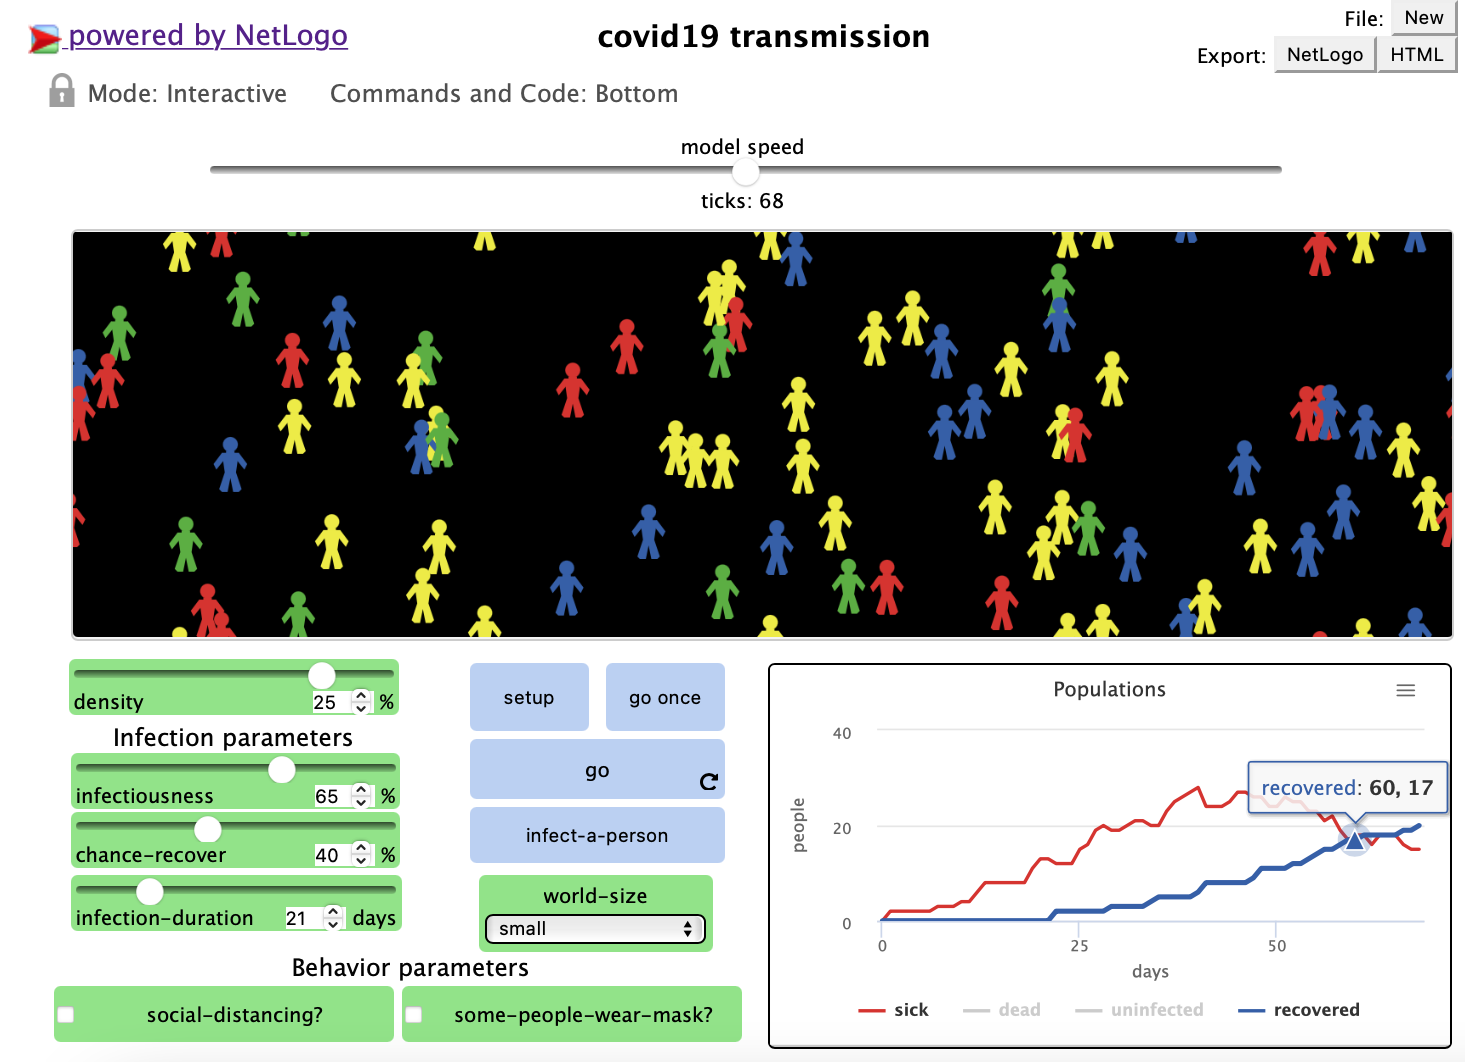
Use the graph above to answer the questions below.
Question 2.1
What is the title of the graph?
What information is on the x - axis?
What information is on the y - axis?
Question 2.2
What conclusion can you make about the trends of the lines for the sick and for the recovered?
Question 2.3
Describe what is happening to the population of people on day 60?
Question 2.4
On what day is there the biggest difference between the number of people sick and the number of people recovered?
Question 2.5
Describe what the graph will look like at 80 days if this trend line continues.
3. The NetLogo Model
It is time to take a closer look at a NetLogo Model and then to understand all the 'parts' of the model. Feel free to explore and experiment with the model. You cannot break it (or can you?). It might be useful to take notes for the terms you do not understand.
Question 3.1
What are infection parameters and behavior parameters in the model? Choose one of the parameters, and make a guess about how that parameter would affect the spread of the disease.
Question 3.2
SAQ: Describe a 'turtle' as it is used in NetLogo.
Question 3.3
When do you use the 'set-up' button? This may be a hint as to how to make the model work!
Question 3.4
Set up and run the model. After 100 ticks, look at the graph. Be sure to zoom in so you can really see the results. Write your results for the 75th tick in the space provided. Then write the parameters you used to 'setup' your model.
Question 3.5
So what does this have to do with Ingrid and her story? Remember our questions from Lesson 2 Page 1: How did Ingrid contract COVID-19 without coming in contact with an active case? Answer this question: How can we use the NetLogo to inform us on safe practices in a pandemic?
