Write down two things you noticed about the model.

Unit Overview
Through the manipulation of the NetLogo Model, students will explore what relationship COVID has with humans, understand how it spreads, and then apply what they have learned to work with a Computational Model to predict outcomes for the future.
The Unit is designed with Special Education Students and English Language Learners in mind. Therefore, many supports are built into the lessons. Teachers can pick and choose the supports necessary to help their students experience discovery and success within the Unit. In Lesson 3, you will find Graphing Instruction. These lessons will help your students read the information generated by the NetLogo Model graphs. Be sure to experience how to use the graphs, yourself, so you can instruct the students on the zoom and isolation features.
COVID-19 is a scientific phenomenon, it is also a social, financial, and emotional phenomenon affecting people all over the world in many and differing ways. Unless there is discussion, there is no way to measure how it has affected our students. There are reflection questions built into Lesson 2 and a mother shares her COVID story designed to get students thinking and talking.
If your students have difficulty with reading, please use the Google Accessibility features. Also, science has a lot of technological language. Students who are more comfortable with another language can easily using Google Translate Document in the Tools drop down to translate documents into a language they understand better.
Assume students know:
How to use a computer.
Can read.
Understand that COVID-19 is a worldwide pandemic.
Standards Addressed:
Next Generation Science Standards (NGSS) HS-ETS1-2 Engineering Design
|
|
||
|
|
||
|
|
||
|
|
|
|
|
|
||
|
|
||
|
|
||
|
|
||
Standards
Next Generation Science Standards
- Engineering, Technology, Applications of Science
- [HS-ETS1-1] Analyze a major global challenge to specify qualitative and quantitative criteria and constraints for solutions that account for societal needs and wants.
- NGSS Crosscutting Concept
- Patterns
- Causation
Underlying Lessons
- Lesson 1. Copy of Can a Computer Model Inform Us of Safe Practices During a Pandemic?
- Lesson 2. Copy of What is so dangerous about COVID-19?
- Lesson 3. Copy of How can we create a model that explains which options provide the best protection?
- Lesson 4. Copy of How Can We Test COVID-19 Risk Factors?
- Lesson 5. Copy of COVID-19 Risk Factors - What did we learn?
- Lesson 6. Copy of Design Your Own Model

Lesson 1 Overview
In this opening lesson, students will use a NetLogo Model and explore how it works. As an introduction, we will work with a NetLogo Computational Model that involves the spread of COVID-19 through a neighborhood. This way we will learn how a computational model can be used for figuring things out. Later in the Unit, we will meet Ingrid and try to solve a mystery using a different Model designed to answer our question.
Lesson 1 Activities
- 1.1. Understanding a Little Bit About How Computer Models Work
- 1.2. Exploring NetLogo Code
- 1.3. Reflection
1.0. Student Directions and Resources
Throughout this module you will learn about computational thinking, computer coding, and a current health crisis. You will investigate the following question:
Is it possible to design a computer model to gather evidence to inform human response to a current health crisis?
In this lesson, we will introduce you to using computer models to gather data on a current, real world, situation.
You will need the following resources to complete this assignment.
1.1. Understanding a Little Bit About How Computer Models Work
Although we are not working directly on the spread of COVID-19 in neighborhoods, the above program is a computational model and is similar to what we will be using to create our model for research. This is a great practice model and a wonderful way to experiment with a computational model. So, just for now, imagine that you are observing a neighborhood using a drone that is hovering over the roof tops. Each green patch represents a house. A blue patch represents a house with positive COVID-19.
Play around with the model. Try to make some observations of what is happening.
Question 1.1.1
Question 1.1.2
Change the Density of the houses to 30%. What happens to the neighborhood when the model stops running? How many ticks did the model go through before it stopped and why do you think it stopped at this number of ticks?
Question 1.1.3
SAQ: What is a tick? What evidence did you use to create your definition?
Question 1.1.4
Now change the Density of the houses to 60%. What do you notice after 100 ticks?
Question 1.1.5
SAQ: Based on what you observed, make a statement about the effect of house density in a pandemic.
1.2. Exploring NetLogo Code
The computational model that you used on the last page is created using a software called NetLogo. You can easily access the computational code in a NetLogo model. Let's try to understand the computational code that makes this model work.
Question 1.2.1
SAQ: Open the NetLogo tab. Look for the code that reads:
Line 18 if (random 100) < density
Line 19 [ set pcolor green ]
Line 20 ]
Where it says pcolor green, what would happen if we wrote blue instead of green? Write your hypothesis.
Question 1.2.2
Now rewrite this part of the code to say blue instead of green. Click on setup and then on go. Describe what happens.
Question 1.2.3
Was your hypothesis from the previous question correct? Why or why not?
Question 1.2.4
What information could a scientist gather from this model?
1.3. Reflection
Question 1.3.1
List at least one big idea that you learned in this lesson.
Question 1.3.2
Pick any computational tool/activity that you have used in this lesson. What is the tool and how did you use it to learn?
Question 1.3.3
From what you have seen so far, how else could we use this model?

Lesson 2 Overview
The lesson here is a true SEL moment. Everyone has realized an affect from COVID-19 which makes this an important and teachable time. The video Storyline is meant to be used as an icebreaker and as a ‘backdrop’ to better understand the Driving Question. The teacher should be prepared to listen and reflect. There is no need to have answers, just listen and reflect. Remember to check in with your students every day about how they are functioning and what they are feeling. COVID-19 is very real for many people.
Lesson 2 Activities
- 2.1. Ingrid's Story: How can someone contract COVID-19 without coming in contact with an infected person?
- 2.2. Reflections on COVID-19.
2.0. Student Directions and Resources
COVID-19 has had a large impact on cities, towns, families, individuals, the world as a whole, and life as we know it. Everyone has been affected in one way or another. People argue over how it started, protection measures, and who's to blame. For our purposes, we will leave all the arguments to the politicians. We will, instead, shift our focus to what we can do and why we should do it as we meet Ingrid and try to solve a mystery.
2.1. Ingrid's Story: How can someone contract COVID-19 without coming in contact with an infected person?
Meet Ingrid, a 29 year old single Mom who, in May of 2020, had symptoms of COVID-19 and then tested positive for the virus. Use a critical ear as you listen closely to her story and then answer the following questions. Click on the video below to start it.
Question 2.1.1
How did Ingrid contract the COVID-19 virus?
Based on her actions, what could or should she have done to keep herself more safe?
Question 2.1.2
What worried Ingrid the most about having COVID-19?
Question 2.1.3
Why did Ingrid's daughters not have symptoms?
Question 2.1.4
What other questions are you left with after hearing this story? Write at least one inquiry.
2.2. Reflections on COVID-19.
COVID-19 has disrupted the way of living for the entire world. This in turn has caused lots of trauma for some people. However, not everyone has had the same experiences or responses. The questions below are designed for you to reflect on your own experiences during the past few months. Answer the following questions to the best of your ability. It is not expected that you share what you wrote or think, but it would sure be great if you could find the strength to share.
Question 2.2.1
What has been your experience with COVID-19?
Question 2.2.2
In the space provided, write about how you and the people in your household are getting along. How is this different than before the pandemic?
Question 2.2.3
What would you like to share that has not been asked or answered? Would you like help from the teacher? Please use this space to write your questions or concerns.

Lesson 3 Overview
At this time, we have learned much about COVID-19 and its effects. We have learned some of the things that have worked to protect ourselves and others. There are a lot of differing opinions throughout the world and we are left to wonder: Who's right? What's wrong? In this lesson, students will learn how to read the NetLogo graphs and begin to learn the NetLogo language. The NetLogo Model is programmed to clearly represent the effectiveness of masking and social distance. Graphing Practice is provided in Pages 1 and 2. On Page 3, students will have time to experiment with the model.
***The NetLogo graph is interesting to use. There is a zoom feature so the observer can see a moment in time (number of days). There is also an isolation feature so the observer can look at just one result: sick, dead, uninfected, recovered.
Lesson 3 Activities
- 3.1. Graphing Practice
- 3.2. Graphing Practice (two plot lines)
- 3.3. The NetLogo Model
3.0. Student Directions and Resources
The NetLogo Model will help us to understand the effects of COVID-19 on the human population. Information is compiled into line graphs that we can use to better understand results. However, we need to know how to read the graph so practice is supplied in this Lesson. Then, in order to understand the model, you will need to understand the NetLogo coding language. Not to worry, this is new for all of us. You will experiment with different parameters within the model to demonstrate what happens when humans practice safety when traveling in a world with COVID-19. Relax and enjoy!
You will need the following resources to complete this assignment.
3.1. Graphing Practice
In this part of the unit, you will use a different NetLogo model. This model is about the transmission of disease and the social behavior of people.
Let's first understand how to read graphs in the model.

Use the above graph to answer the following questions. Be sure to label your answers.
Question 3.1.1
What is the graph showing us on the y - axis?
Question 3.1.2
Using the graph, what is the number of sick on day 20?
Question 3.1.3
Based on what you know on the graph about the number of sick, what does the 40% represent?
Question 3.1.4
What does the 28 represent on the line graph?
Question 3.1.5
After day 40, what is the 'trend' in the number of sick? Why do you think this is happening?
3.2. Graphing Practice (two plot lines)
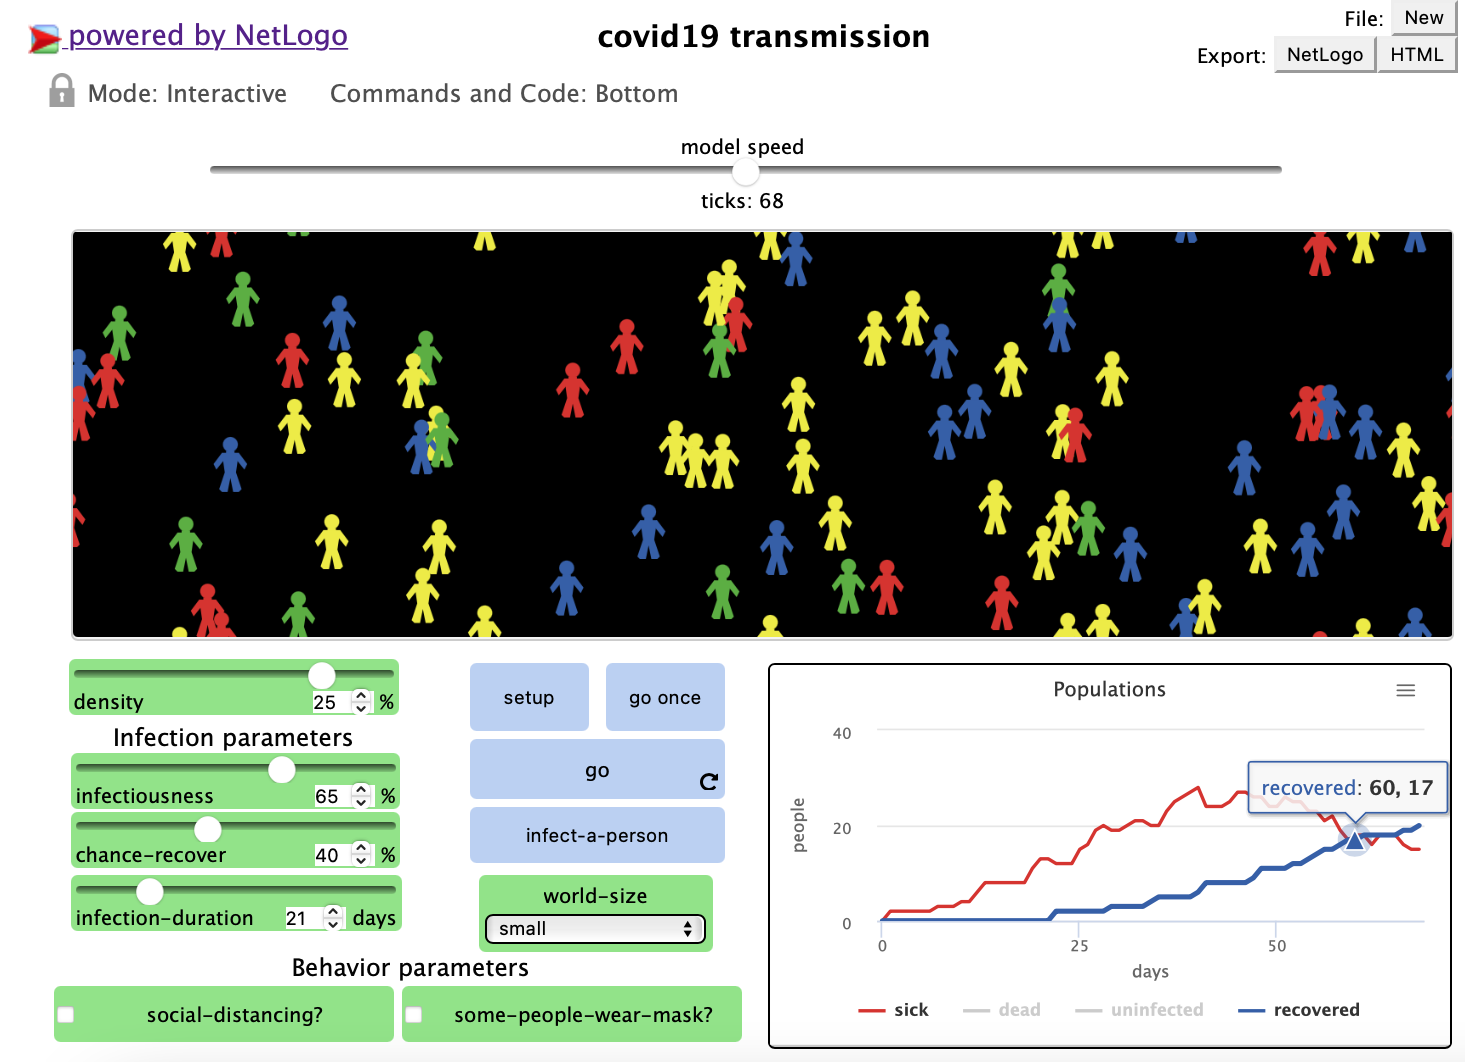
Use the graph above to answer the questions below.
Question 3.2.1
What is the title of the graph?
What information is on the x - axis?
What information is on the y - axis?
Question 3.2.2
What conclusion can you make about the trends of the lines for the sick and for the recovered?
Question 3.2.3
Describe what is happening to the population of people on day 60?
Question 3.2.4
On what day is there the biggest difference between the number of people sick and the number of people recovered?
Question 3.2.5
Describe what the graph will look like at 80 days if this trend line continues.
3.3. The NetLogo Model
It is time to take a closer look at a NetLogo Model and then to understand all the 'parts' of the model. Feel free to explore and experiment with the model. You cannot break it (or can you?). It might be useful to take notes for the terms you do not understand.
Question 3.3.1
What are infection parameters and behavior parameters in the model? Choose one of the parameters, and make a guess about how that parameter would affect the spread of the disease.
Question 3.3.2
SAQ: Describe a 'turtle' as it is used in NetLogo.
Question 3.3.3
When do you use the 'set-up' button? This may be a hint as to how to make the model work!
Question 3.3.4
Set up and run the model. After 100 ticks, look at the graph. Be sure to zoom in so you can really see the results. Write your results for the 75th tick in the space provided. Then write the parameters you used to 'setup' your model.
Question 3.3.5
So what does this have to do with Ingrid and her story? Remember our questions from Lesson 2 Page 1: How did Ingrid contract COVID-19 without coming in contact with an active case? Answer this question: How can we use the NetLogo to inform us on safe practices in a pandemic?

Lesson 4 Overview
In this lesson, students will begin to work on the NetLogo Model. There are questions, and activities that require Scientific and Computational thinking. Students will use the NetLogo Model to make predictions and to test their predictions. Then students will revise their questions and hypotheses, perform experiments, and answer further questions. Students will be trying to discover how to use a computational model to explain and predict.
For our purposes, we will use statistics from the Diamond Princess Cruise ship which was quarantined for 2 weeks in Yokohama, Japan starting February 5, 2020, when a passenger tested positive for a severe acute respiratory syndrome coronavirus 2; SARS-CoV-2 known as COVID-19. Kenji Mizumoto, Katsushi Kagaya, Alexander Zarebski, and Gerardo Chowell created a statistical model to analyze the number of cases compared to the number of positive test results and within that figure the number of symptomatic and asymptomatic individuals. Of the 634 confirmed cases, a total of 306 and 328 were reported to be symptomatic and asymptomatic. This led us to create an infection model where 50% of the infected people show no symptoms or are asymptomatic and 50% of infected individuals show symptoms or are considered symptomatic.
Mizumoto Kenji , Kagaya Katsushi , Zarebski Alexander & Chowell Gerardo . Estimating the asymptomatic proportion of coronavirus disease 2019 (COVID-19) cases on board the Diamond Princess cruise ship, Yokohama, Japan, 2020. Euro Surveill. 2020;25(10):pii=2000180. https://doi.org/10.2807/1560-7917. ES.2020.25.10.2000180
Lesson 4 Activities
- 4.1. A Little Experimentation
- 4.2. Becoming Familiar with NetLogo
- 4.3. Let's Add Some Social Distancing
- 4.4. Now Let's Try Some Masks
4.0. Student Directions and Resources
You will begin using the NetLogo Model and experiment with the model in the upcoming periods. Again, be bold and experiment. Be sure to RECORD your original questions, hypotheses, and predictions and then record your findings and observations.
4.1. A Little Experimentation
You have time to explore the Model and play around with some parameters of the NetLogo Model. Be sure to use the graph feature to observe your data. Write down your observations in numbers (data) from the graph.
Question 4.1.1
When you start using the model, what is the first thing you changed? What happened?
Question 4.1.2
SAQ: Now it's time to experiment with the Behavior Parameters. Choose one of the Behavior Parameters and change its values. Run the model at least 75 ticks (days) (maybe more so you will notice a change in the graph). Explain how the parameter affects the spread of disease in the model.
4.2. Becoming Familiar with NetLogo
Here is where we get going. You will have a chance to manipulate the NetLogo Model. Please take care to answer questions when requested. Go in order and follow directions. Use the information generated in the graph to help you collect data and answer questions.
Question 4.2.1
What do you think will happen to a large number of people in a small area, without protection, in a COVID-19 hotspot? How do you know or why do you think this?
Question 4.2.2
Before changing the model, predict what will happen if you,
Click set-up
Click the infect-a-person button, 10 times.
no social distancing? and no face masks?.
Write an observation before running the model.
Write an observation after running the model for 100 ticks.
Question 4.2.3
Alrighty. that was fun! Now try this:
Predict what will happen in the Model, if you:
Click on big size world
Click set-up
Click on infect-a-person 10 times
no social distancing and no face masks
Move the Density Slider to 30%, Infectiousness to 65%, chance-recover to 40 5, infection-duration to 21 days
Write an observation NOW before running the model.
Run the model for 100 ticks. Using the graph, write your result (data).
Question 4.2.4
You have information from a graph and what you saw happen in the Model from question 3. How did the numbers change and why did the numbers change the way they did?
Question 4.2.5
SAQ: In the table below write:
One learning
One wondering
AND one thing you want to try with the NetLogo Model, going forward.
4.3. Let's Add Some Social Distancing
For this page, we will start to add Social Distancing to our Model and observe what happens.
Question 4.3.1
Set-up your Model this way:
Write a prediction about what will happen in the Model, if you:
Click on big size world
Click set-up
Click on infect-a-person 30 times
no face masks
Move the Density Slider to 30%, Infectiousness to 65%, chance-recover to 30%, infection-duration to 21 days, and click the social-distancing?
Write your PREDICTION.
Question 4.3.2
SAQ: Write your findings, from the graph, after running the Model for 100 ticks. Is it the same as the beginning numbers? What is happening? How do you know?
Question 4.3.3
Suppose we change the number of ticks to 150. Write a hypothesis of what the results will be.
Now run the model for 150 ticks.
Look at the graph and write your results.
What happened? Did it match your prediction?
Question 4.3.4
What will happen if you change the infection-duration in the model you designed in question 3? Why do you think this?
Try it.
What did you find?
Question 4.3.5
Run the Model with the parameters you choose.
Be sure to write the parameters and RESULTS in the space provided. Using the graph to understand your results, write about what your results tell us about practices during a COVID-19 pandemic.
4.4. Now Let's Try Some Masks
On this page we will add masks as a Safety Precaution. Run the model with masks as the only precaution. And then run the model with masks and social distancing. The parameters you chose (world size, density, infectiousness, etc) are up to you. Remember that in any good Scientific Experiment the Scientific Method is used.

To draw a useful conclusion use the graph feature. It is the best way to compare your results. Remember to change only one thing at a time. For example, if you want to test to see if masks are effective, set-up your NetLogo Model with the same parameters and run the Model with masks and without masks. In other words, change 1 thing and record your results. Okay, it's go time!!
Question 4.4.1
SAQ: Write your hypothesis for this question: Can a Computer Model Inform Us of Safe Practices During a Pandemic?
[A hypothesis is a statement that you can test using the evidence that you collect.]
Question 4.4.2
Design a simulation (experiment) to test your hypothesis. Explain your experimental design in the space below.
Question 4.4.3
Conduct the simulation (experiment). Use information from the graph and record your results.
Question 4.4.4
Using the information you gathered from the graph write your analysis of what is important to prevent contracting COVID-19.

Lesson 5 Overview
In this lesson, students will begin to work on the NetLogo Model. There are questions, and activities that require Scientific and Computational thinking. Students will use the NetLogo Model to make predictions and to test their predictions. Then students will revise their questions and hypotheses, perform experiments, and answer further questions. Students will be trying to discover how to use a computational model to explain and predict.
For our purposes, we will use statistics from the Diamond Princess Cruise ship which was quarantined for 2 weeks in Yokohama, Japan starting February 5, 2020, when a passenger tested positive for a severe acute respiratory syndrome coronavirus 2; SARS-CoV-2 known as COVID-19. Kenji Mizumoto, Katsushi Kagaya, Alexander Zarebski, and Gerardo Chowell created a statistical model to analyze the number of cases compared to the number of positive test results and within that figure the number of symptomatic and asymptomatic individuals. Of the 634 confirmed cases, a total of 306 and 328 were reported to be symptomatic and asymptomatic. This led us to create an infection model where 50% of the infected people show no symptoms or are asymptomatic and 50% of infected individuals show symptoms or are considered symptomatic.
Mizumoto Kenji , Kagaya Katsushi , Zarebski Alexander & Chowell Gerardo . Estimating the asymptomatic proportion of coronavirus disease 2019 (COVID-19) cases on board the Diamond Princess cruise ship, Yokohama, Japan, 2020. Euro Surveill. 2020;25(10):pii=2000180. https://doi.org/10.2807/1560-7917. ES.2020.25.10.2000180
Lesson 5 Activities
- 5.1. And Now, Let's Add Masks AND Social Distancing
- 5.2. Computational Thinking: Putting It All Together
5.0. Student Directions and Resources
You will begin using the NetLogo Model and experiment with the model in the upcoming periods. Again, be bold and experiment. Be sure to RECORD your original questions, hypotheses, and predictions and then record your findings and observations.
5.1. And Now, Let's Add Masks AND Social Distancing
You will now perform another computational experiment on your own. Your teacher will provide guidance and questioning to direct your learning and experimentation. You should be working to draw a conclusion about safety practices and COVID-19. Remember, it is not your OPINION that we are looking for. It is a fact based conclusion with scientific research and experimentation to back up what you are saying. You know, FACTS. In the end you will make a Claim, back it up with Evidence, and finally use Reasoning to tie it all together. You got this!
Question 5.1.1
How did you set-up your NetLogo Model to test for the wearing of masks and using social distancing?
Question 5.1.2
Using evidence from the graph, what claim can you make about wearing a mask and social distancing together?
Question 5.1.3
What information/advice do you feel confident about sharing with your family and friends about the use of masks and social distancing?
Question 5.1.4
SAQ: What are some questions that you are left with? (at least 2). What would you like to add or remove from the model to help you answer those questions?
5.2. Computational Thinking: Putting It All Together
You have completed a lot of great work and learning. You have used a NetLogo computer model to take a question (Why is COVID-19 so dangerous and What Can We Do to Mitigate Risk?) and quantify it into evidence-based claims. In the case of our NetLogo Model, the results are given to us as information in a graph. It's time to put it all together. What do the numbers tell us?
Question 5.2.1
SAQ: You have collected data about the number of Sick, Dead, Infected, and Recovered people in the models that you have run.
In the space provided, use the drawing tools to recreate your data. Be sure to label the x and y axes. Share all the information you collected.
First, draw the lines in the graph to show it would look when people are not following social distancing and wearing masks.
Note: Draw your sketch in the sketchpad below

Question 5.2.2
SAQ: Now, draw the lines in the graph showing Sick, Dead, Infected, and Recovered people when people follow social distancing and wear masks.
Note: Draw your sketch in the sketchpad below

Question 5.2.3
SAQ: The NetLogo COVID-19 Transmission Model is very effective at giving us some information. However, it does not give us all the information we may need. What are the limitations of the model? List at least 3.
Question 5.2.4
SAQ: On a scale of 1 to 10 with 10 being the best, how effective do you think your research is? In other words, how well do you think the NetLogo Covid-19 Transmission Model is at answering our question? Why do you think this?

Lesson 6 Overview
At this time students will work with the NetLogo Model to create a model of their own design. Before teaching this Lesson the teacher might want to try the lesson before teaching it as programming can be tricky. Students are requested to change 1 thing. However, some students will not be able to complete this request while others will be able to change more than one thing.
Lesson 6 Activities
- 6.1. The Model
- 6.2. Your Turn!
6.0. Student Directions and Resources
You will have time to "play" with the NetLogo Model. Using the original Neighborhood Spread Model, you will write an experimental question, add or change a parameter in the code to answer the question, while working with the NetLogo Model to answer your question. You will be requested to change some code in the model. Be bold and be brave. You cannot break the Model. At least, permanently! It is now time to answer our original question: Can a Computer Model Inform Us of Safe Practices During a Pandemic?
6.1. The Model
For the Neighborhood Spread Model we were able to see what would happen with the spread of COVID in a larger neighborhood. We were able to experiment with the Density, Infectivity-of-Virus, Behavioral-Prevention, and Vaccinated-%. We can change these parameters using the sliders. After running the model for a specified number of ticks, we can see the results: Total Percentage Infected, Low-Density Area Percentage Infected, and High Density Area Percentage Infected. If you are unfamiliar with how this works, please start here and gain some better understanding. Be sure to run the model more than once (with the same parameters) to get insight into what is really going on.
Now that you have a better understanding of the model let's experiment! You will be using the NetLogo Code dropdown screen to complete this section. Take a look at it. What do you see? Line and lines of writing, right? Take a few minutes to try to understand what these lines of writing are telling the computer to do.
Question 6.1.1
Summarize, in your own words, what the lines 9 and 10 are telling the computer to do.
Question 6.1.2
To make infected households look red what will you change in the code? (Hint: line 67). Now try it out.
**Note: Did you remember to click on "RECOMPILE CODE?"
Question 6.1.3
One last question: Look at Line 57.
To increase the effect of behavioral prevention, what would you change? How will that affect the spread of the disease? Test and see if your prediction is correct.
6.2. Your Turn!
You have made some changes to the NetLogo Code. They were 'prescribed' changes. In other words, you were told what to do. Now it's time for you to decide what changes or additions you want to make to the Neighborhood Model. As you progress, record your findings. This is for two purposes: to alert you to what works (and what doesn't) and for you to record your results.
Question 6.2.1
Think about what you have learned throughout this Unit. What questions are you left with that are unanswered? Do you want to understand the Delta Variant and the risk of contagion? Maybe you want to understand the rate of infection in vaccinated and non-vaccinated individuals? Would you like to better understand what would happen if some people had the third shot of the vaccine?
You can program any of these parameters into the NetLogo Model. Your task at this time is to develop a question that can be answered by manipulating or changing the NetLogo Model. Please write your question in the space provided.
Question 6.2.2
Use the Netlogo Code dropdown menu to change the code to answer the question you wrote. Copy and paste or Screenshot the the code you added, changed, or rewrote.
Question 6.2.3
What were the results?
total-%-infected:
low-density-area-%-infected
high-density-area-%-infected
Was there a Result Parameter that you added and if so what were the results?
Question 6.2.4
When you ran the Model after completing your changes:
What worked?
What didn't work?
|
Reflect upon your work. Why did the changes you made work or not work? |
Question 6.2.5
And finally, our last question; Can a computer model inform us of safe practices during a pandemic? As always, provide evidence for your answer!
