Why do you think the gas tanker imploded? Be as specific as possible, and be prepared to share your answer with your lab group.
Unit Overview
Students will explore kinetic molecular theory and gas laws.
- Students will practice the skill of modeling microscopic gas particle interactions to explain the macroscopic behavior of gases.
- Student will practice the skill of argumentation using the claim-evidence-reasoning, which they will use throughout the year in honors chemistry.
At the end of the unit, students should be able to describe the motion of gas particles and predict how changing one or more variables will impact the gaseous system.
Standards
Next Generation Science Standards
- NGSS Practice
- Using Models
- Using Mathematics
Underlying Lessons
- Lesson 1. Phenomenon Introduction
- Lesson 2. Investigations Involving Pressure and Volume
- Lesson 3. Modeling Temperature
- Lesson 4. Investigations Involving Temperature and Volume
- Lesson 5. Kinetic Molecular Theory
- Lesson 6. What is Pressure?
- Lesson 7. Pressure and Temperature & The Kelvin Scale
- Lesson 8. Can Crusher Lab
Lesson 1 Overview
Observing and modeling a gaseous phenomenon
Lesson 1 Activities
- 1.1. The Phenomenon
- 1.2. Creating a Model
1.0. Student Directions and Resources
In this lesson you will observe a gaseous phenomenon. You will then be asked to create a model of the phenomenon in order to explore different gas variables that give rise to that phenomenon.
1.1. The Phenomenon
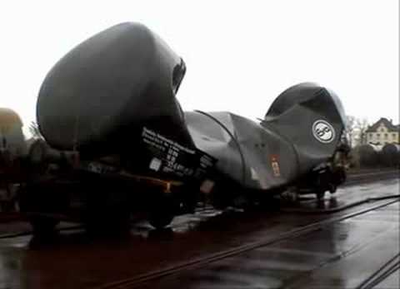
Watch the video of the gaseous phenomenon and then read the information below that explains the events that led up to the incident.
On Thursday, April 4, 2019, a Burlington Northern train unloaded its cargo in Union Station’s railroad yard. As with all train cars after being unloaded, the local railroad crew was assigned the task of cleaning the interior of each car. Since the train cars were not unloaded until near the end of the evening working shift, the crew members were rushed to finish the job.
With cleaning equipment in hand, each worker steam cleaned the inside walls of each train car. Once completed, the tanker car was sealed. Since it was already 9 PM, each worker was eager to “clock out” and return home for the night. The tanker car sat sealed overnight.
When the Burlington Northern employees returned to work the next morning, all employees were required to gather, view, and record a video of a safety training procedure with the tanker. However, to the surprise of everyone, something dramatic happened and was captured on video. The video shows the very tanker that was cleaned and sealed the night before imploding before their eyes. The overwhelming question among the Burlington Northern employees is what had happened to the tanker?
How could a train car with a steel plate thickness of 1.11 cm suddenly collapse overnight? It is hard to imagine the forces it took to do this much damage, to such a large steel object. As a Chemistry Safety Engineer for Burlington Northern, your task will be to determine what happened on the morning of April 5, 2019 to the imploded tanker.
Question 1.1.1
1.2. Creating a Model
On the previous page you explained why you believe the gas tanker imploded; your answer is referenced below. Now each member of your group will share their explanations in order to come to a consensus as a group. Your group must agree on an explanation before proceeding to model creation below.
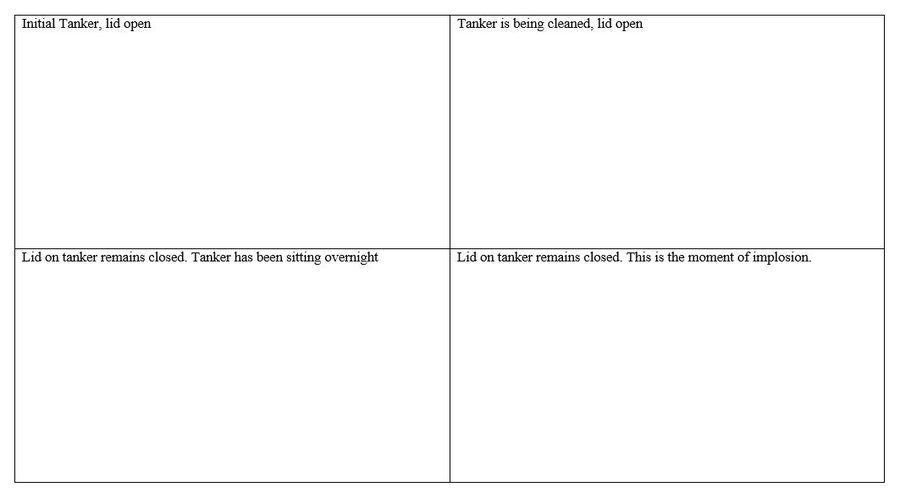
In order to create a model, the events from that night in April 2019 will be broken down to four distinct moments in time. The first moment is the gas tanker sitting open prior to cleaning. The second moment is during the steam cleaning, again with the lid still open. The third moment is after the steam cleaning with the lid closed while the tanker sits overnight; this actually spans the greatest amount of time as the tanker sitting all night needs to be considered here. The final moment is the gas tanker imploding with the lid still closed.
Question 1.2.1
Draw a model below that represents why your group thinks the tanker crushed. Your model should include 4 panels:
- Initial Tanker with Open Lid
- During Steam Cleaning with Open Lid
- After Steam Cleaning / Overnight with Closed Lid
- Implosion With Closed Lid
Include drawings of what you cannot see that might relate to the cause of the crushing, and remember that your model needs particles!
Note: Draw your sketch in the sketchpad below
Lesson 2 Overview
Hands-on investigations into the relationship between pressure and volume
Lesson 2 Activities
2.0. Student Directions and Resources
As most students surmised, pressure is involved in the implosion of the gas tanker. In this lesson, we will conduct a variety of hands-on investigations to explore the relationship between pressure and volume.
You will need the following resources to complete this assignment.
Lesson 3 Overview
Examining and creating models for microscopic particle behavior
Lesson 3 Activities
- 3.1. Predicting Movement: Hot vs. Cold
- 3.2. The Experiment: Hot vs. Cold
- 3.3. The Claim-Evidence-Reasoning Structure
- 3.4. Claim-Evidence-Reasoning For Hot vs. Cold
- 3.5. Modeling Particle Movement
3.0. Student Directions and Resources
Typically in chemistry we cannot directly observe what is happening because it is occurring on a microscopic level. In order to better understand the cause of our macroscopic observations, we will need to examine microscopic particle behavior and create models to represent what we cannot see.
3.1. Predicting Movement: Hot vs. Cold
You will observe food coloring added to both hot and cold water.

In the question below you will be asked to make a prediction about the speed of the spread of the food coloring in both temperatures of water.
Question 3.1.1
Will the food coloring travel faster in hot water, the cold water, or the same in both temperatures? Explain why you chose your answer based on past experience or prior knowledge.
3.2. The Experiment: Hot vs. Cold
Three trials of the experiment are shown below, view each one separately. You will be recording both qualitative and quantitative measurements for each trial below the videos.
Trial 1
Trial 2
Trial 3
Question 3.2.1
In which temperature water did the food coloring spread faster? Be sure to include observations from the experiment in your answer.
Question 3.2.2
Use the stopwatch on your phone to acquire quantitative data for each trial.
3.3. The Claim-Evidence-Reasoning Structure
In chemistry class, when we answer a question, we call that answer a "claim". You may have heard this term before, in relation to the explanation structure Claim-Evidence-Reasoning. A claim states the relationship between your independent variable and your dependent variable. You do not provide any data or explanation of why this relationship exists.
Evidence is data that we gather in class, organized to support a claim. It is important that you realize that the data you record from an experiment in class is not automatically evidence. To produce evidence, you will pull two data points from your raw data to support the relationship stated in your claim. For a lab report, you will be required to compose evidence with multiple data point sets. Quantitative data is prioritized over qualitative data if available.
Reasoning is the explanation of why the data is appropriate (i.e., why is this data relevant?) and how the data support the claim. This is where you explain the science behind why your evidence supports your claim.
You already made a claim to answer the question: "In which temperature water did the food coloring spread faster?" on the previous page. It was clear in the experimental video that the food coloring spread faster in hot water. Below, you will be asked to support that claim with evidence and to explain why your evidence supports that claim with reasoning.
Question 3.3.1
Write evidence to support the claim that food color moves faster in hot water than it does in cold water using data from the experiment presented on the previous page of this lesson. The data table with averages is referenced above to help you answer this question. Use the format provided below to write your evidence statement.
<Evidence Statement>
According to the text/data table/diagram…
When (description of IV, independent variable, condition) the (insert qualitative or quantitative description of DV, the dependent variable)
Question 3.3.2
Now explain you evidence using reasoning. Your reasoning should include more than simply rehashing the data from the evidence portion of your explanation.
Particles will move (faster/slower) in a high temperature environment compared to a cold temperature environment, resulting in a (direct/indirect) relationship between particle movement and temperature. In summary, here is how the evidence supports my claim: ... Therefore...
3.4. Claim-Evidence-Reasoning For Hot vs. Cold
If we were to write a claim evidence reasoning statement to answer the question "In which temperature water did the food coloring spread faster?", it would look something like this:
Reasoning: Hot p
3.5. Modeling Particle Movement
The following image shows food coloring particles in hot water vs cold water, according to how we will model things in our class. Examine the model and answer the questions below.

Question 3.5.1
If they weren't labeled as hot particles, how would you tell which particles are warmer?
Question 3.5.2
Which space has more particles?
Lesson 4 Overview
Exploring the effect that temperature has on a volume of gas
Lesson 4 Activities
- 4.1. Temperature's Effect on Volume of a Gas
- 4.2. A Simulation
- 4.3. Data Collection With the Simulation
- 4.4. Interpreting the Graph
- 4.5. Modeling Temperature and Volume of a Gas
4.0. Student Directions and Resources
In the last lesson, we made a claim about temperature and particle motion after observing that hot particles move faster than slower ones. In this lesson, we will begin to focus on gaseous particles by exploring the effect that temperature has on a volume of gas.
4.1. Temperature's Effect on Volume of a Gas
Watch both videos below and then answer the questions that follow.
Question 4.1.1
Describe what happens to the shape and size of the balloon attached to the flask when the flask is heated.
Question 4.1.2
Describe what happens to the shape and size of the balloon attached to the flask when the flask is cooled.
Question 4.1.3
Based on your observations, what do you think is happening to change the shape and size of the balloon when the flask is placed in environments with different temperatures?
4.2. A Simulation
The simulation below shows gas particles inside a container with a moveable lid.
Begin the simulation by hitting "setup" and then “go/stop”. Observe the gas particles as they move around the inside of the container. You have control over the temperature inside the container which can be adjusted by moving the slider bar labeled "gas-temperature".
As soon as you feel comfortable with the functionality of the simulation, move on to answer the questions below.
Question 4.2.1
Observe the gas particles at 23°C, do they all appear to be moving at the same speed?
Question 4.2.2
Describe what occurs when you raise the temperature to its maximum setting. Include both what gas particles are doing and the overall volume of the container in your description.
Question 4.2.3
Describe what occurs when you reduce the temperature to its lowest setting. Include both what gas particles are doing and the overall volume of the container in your description.
4.3. Data Collection With the Simulation
Now you will acquire data and create a graph using the same simulation integrated with an online data analysis platform called CODAP. Below, you will see a CODAP workbench. CODAP will allow us to visualize our data immediately upon entering it into the platform.
Let's begin with familiarizing ourselves with the CODAP environment:
- The platform is below these instructions. Notice the starting volume at room temperature of 23°C has been entered for you.
- Adjust the slider bar labeled "gas-temperature" to a temperature other than the starting temperature.
- Begin the simulation by hitting "setup" and then “go/stop”.
- Allow the simulation to run for 100 ticks before pressing the "record-data" button. Notice that your data will appear in both the data table as well as create a data point on the graph at right.
- Record volume measurements at 3 additional temperatures (for a total of 4 temperatures as 23°C has been entered for you), waiting 100 ticks after changing the temperature to click "record-data" (one should be the minimum temperature and one should be the maximum temperature on the gas temperature slider bar).
- Observe the resulting plot. Then answer the questions below the CODAP workbench.
Question 4.3.1
How does changing the temperature of a gas affect the volume of that gas?
Question 4.3.2
Describe the appearance of the graph you created in CODAP.
4.4. Interpreting the Graph
You created a graph of volume versus temperature on the previous page. We are going to use that graph to determine the relationship between volume and temperature. First we will go over the different types of data relationships.
If you observe your independent variable increasing as your dependent variable increases (or if one variable decreases as the other decreases) your variables are said to have a direct relationship. A graph of two variables (A and B) with a direct relationship is shown below.

If you observe your independent variable increasing as your dependent variable decreases (or if the independent variable decreases as the dependent variable increases) your variables are said to have a inverse relationship. A graph of two variables (A and B) with an inverse relationship is shown below.

Question 4.4.1
What type of relationship exists between temperature and volume of a gas? Cite your graph as evidence for your answer.
4.5. Modeling Temperature and Volume of a Gas
In lesson 2, we concluded that hot particles move faster than colder ones. We reviewed a model of that movement shown below:
This model shows faster moving particles drawn with longer arrows than those that are moving more slowly.
Use this same convention of shorter arrow = colder particles, and longer arrow = hotter particles to complete the model below.
Question 4.5.1
The image below shows a balloon inside at room temperature (23°C). Draw a model of this same balloon if it were taken outside in the middle of January in Chicago (0°C). Draw your model on any paper you have, then take a photo of your model and email it to yourself so you can upload that image.

Upload files that are less than 5MB in size.
| File | Delete |
|---|---|
Upload files to the space allocated by your teacher.
Question 4.5.2
The image below shows a balloon inside at room temperature (23°C). Draw a model of this same balloon if it were taken outside in the middle of August in Chicago (37°C). Draw your model on any paper you have, then take a photo of your model and email it to yourself so you can upload that image.
Upload files that are less than 5MB in size.
| File | Delete |
|---|---|
Upload files to the space allocated by your teacher.
Lesson 5 Overview
Understanding how gas particles move relative to temperature and pressure
Lesson 5 Activities
- 5.1. Kinetic Molecular Theory SImulation
- 5.2. Writing the Rules
- 5.3. Programming
- 5.4. Kinetic Molecular Theory: The Rules
- 5.5. Summary
5.0. Student Directions and Resources
So far in this unit, we have begun to establish basic relationships between gas variables, and we have also agreed on conventions to use for modeling gas particles. In this lesson, we will focus exclusively on gas particle behavior.
Kinetic molecular theory explains microscopic particle behavior based on the macroscopic properties of gases. The goal of this lesson is to understand how gas particles move, and how their microscopic movement is connected to the macroscopic observations of temperature and pressure.
5.1. Kinetic Molecular Theory SImulation
You will explore gas particle motion using the simulation below.
- Select the "Ideal" option at left.
- Pump the pump once and observe the gas particles enter the box. Describe the movement of the particles below.
- Now choose an individual particle to focus on. Follow that particle's movements. Describe the movement of that single particle below.
Question 5.1.1
Describe the movement of the particles after initially pumping them into the box including how they interact with the box and each other.
Question 5.1.2
Now describe the movement of the individual particle you focused on including how that particle interacts with the box and other particles.
5.2. Writing the Rules
Imagine you were the computer programmer that wrote the simulation. The programmer had to provide a set of rules for the movement of the gas particles that they obey in every possible circumstance within the simulation.
The simulation is again shown at right, click on "Ideal", then pump a single pump of gas and let the simulation run.
- Together with your lab table group, you will write out a set of rules that you believe gas particles are following in the simulation. Be as specific as possible and be prepared to share your rules with the class.
Question 5.2.1
Write your rules for gas particle movement and behavior in the box below. Be sure to consider your initial observations of the simulation from page 1 where you focused on the overall particle movement and then the movement of one individual particle. Your answers from page 1 are included above.
5.3. Programming
Now you will use your rules for particle movement from page 2 (they are referenced on this page below) to help you program your own simulation using NetTango.
NetTango is a tool that uses a programming language called NetLogo in preprogrammed blocks. You will be asked to use these blocks to create a working model that best reflects the movement of gas particles you observed in the PhET simulation.
Watch the video that demonstrates how to use the blocks to program gas particle behavior at right.
Start programming!
A few quick points:
- Click
 to reset the model and click
  to run your model.
 - Your code should always start with the
 block, or the model will not know what to do.
 - Your code will be performed by the particles continuously.
- For example, if you wrote that "each particle + moves zig-zag", each particle in the model will move one step forward doing a zig-zag movement and then move one more step forward the same way, and so on. This will keep going on as long as the GO button is pressed.
Question 5.3.1
When you are satisfied with the way the particles behave,  and upload it using the "Browse" button below.
Upload files that are less than 5MB in size.
| File | Delete |
|---|---|
Upload files to the space allocated by your teacher.
Question 5.3.2
Which types of blocks did you use? Explain your reasoning for each block.
Example: block: I used the "moves ____" block | because: I think the molecules moves so and so ...
5.4. Kinetic Molecular Theory: The Rules
Kinetic Molecular Theory is a set of rules used to describe gas particle movement. Scientists assume that all gas particles behave in this manner unless stated otherwise. These rules are as follows:
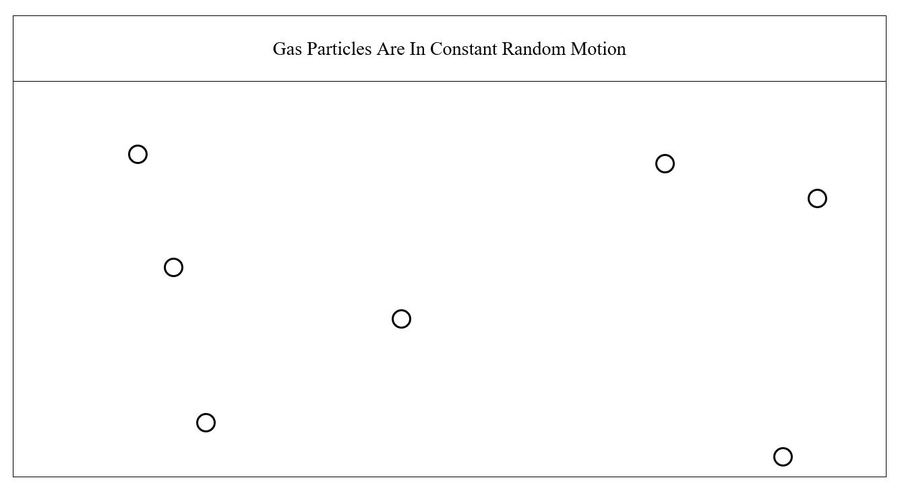
- Gas particles are in constant random motion.
- Gas particles are so small that they may be considered to have no volume relative to the empty space that surrounds them.
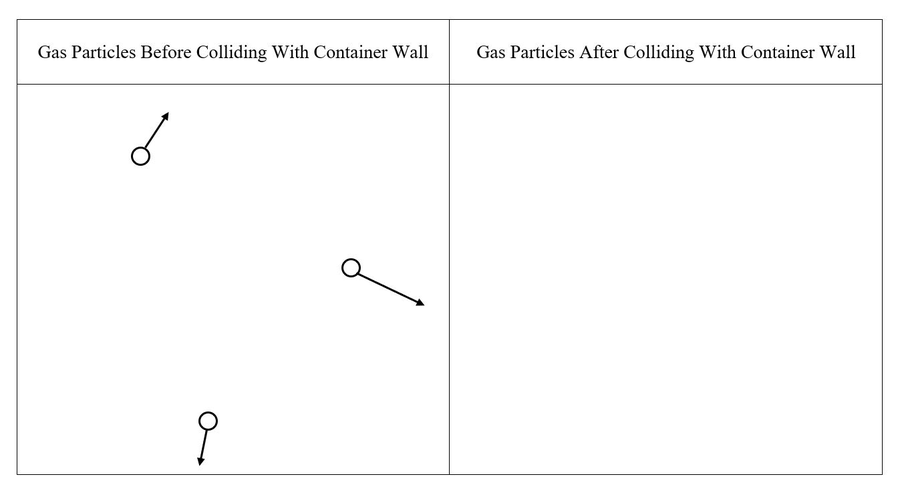
- Collisions with the walls of the container are perfectly elastic. An elastic collision is one in which there is no overall loss of kinetic energy. This means that gas particles do not lose kinetic energy after they collide with the walls of their container.
- Collisions between particles are also perfectly elastic. Kinetic energy may be transferred from one particle to another during an elastic collision, but there is no change in the total energy of the colliding particles.
You will model each of these rules in the questions below.
Question 5.4.1
Draw a model to represent the first rule above: gas particles are in constant random motion. A template with gas particles has been provided for you. Show their motion using arrows.
Note: Draw your sketch in the sketchpad below
Question 5.4.2
Draw a model to represent the second rule of Kinetic Molecular Theory: gas particles are so small that they may be considered to have no volume relative to the empty space that surrounds them.
There is no predrawn template provided for this question.
Note: Draw your sketch in the sketchpad below
Question 5.4.3
Draw a model to represent the third rule of Kinetic Molecular Theory: collisions with the walls of the container are perfectly elastic. An elastic collision is one in which there is no overall loss of kinetic energy.
A template with the before scenario has been provided, you need to draw the after portion of the model.
Note: Draw your sketch in the sketchpad below
Question 5.4.4
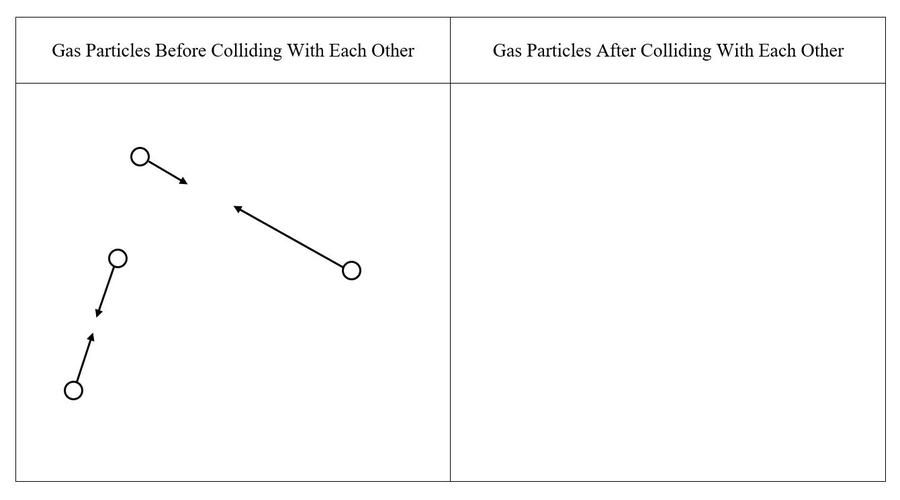
Draw a model to represent the fourth rule of Kinetic Molecular Theory: collisions between particles are also perfectly elastic. Remember that kinetic energy may be transferred from one particle to another during an elastic collision, but there is no change in the total energy of the colliding particles.
A template with the before scenario has been provided, you need to draw the after portion of the model.
Note: Draw your sketch in the sketchpad below
5.5. Summary
On the previous page, you were asked to model the rules of Kinetic Molecular Theory. Below are images showing how those models should appear. Your responses from the previous page are included here so you can compare and contrast them with the correct models.
Rule 1:

Rule 2:

Rule 3:

Rule 4:

Question 5.5.1
Compare your model for rule one (gas particles in constant random motion) to the ideal version provided above. Describe all the differences between the two models.
Question 5.5.2
Compare your model for rule one to the ideal version provided above. Describe all the similarities between the two models.
Question 5.5.3
Compare your model for rule two (gas particles are very small) to the ideal version provided above. Describe all the differences between the two models.
Question 5.5.4
Compare your model for rule two to the ideal version provided above. Describe all the similarities between the two models.
Question 5.5.5
Compare your model for rule three (collisions with the container are elastic) to the ideal version provided above. Describe all the differences between the two models.
Question 5.5.6
|
Compare your model for rule three to the ideal version provided above. Describe all the similarities between the two models. |
Question 5.5.7
Compare your model for rule four (collisions between gas particles are elastic) to the ideal version provided above. Describe all the differences between the two models.
Question 5.5.8
Compare your model for rule four to the ideal version provided above. Describe all the similarities between the two models.
Lesson 6 Overview
Examining how changes in volume and the number of particles affect pressure
Lesson 6 Activities
- 6.1. A Gas Simulation
- 6.2. Defining Pressure
- 6.3. How Does the Number of Gas Particles Affect Pressure?
- 6.4. The Relationship Between Number of Particles and Pressure
- 6.5. How Does Volume Affect Pressure?
- 6.6. The Relationship Between Volume and Pressure
6.0. Student Directions and Resources
Within this unit, we have examined several gas variables in relation to gas particle behavior including temperature, volume, and pressure. In this lesson, we will examine a fourth variable, number of particles.
We will specifically study the effect of two different variables on pressure; we will investigate how changing the number of particles affects pressure, and how changing volume affects pressure.
6.1. A Gas Simulation
Feel free to play around with the simulation, but make sure to refresh your browser before working through the following steps in order to learn how to manipulate the simulation for this lesson.
- Click "Ideal"
- Particles Menu
- Click the green plus sign next to particles
- To subtract or add 1 particle or 50, click the arrows to the left and right of the number of particles
- Reset button
- Click the white button to the left of the pump to reset the simulation.
- Particle Pump
- After resetting the simulation, drag the handle of the pump up and down to add a more random number of particles.
- Pause button
- After adding some particles to the chamber, click the pause button on the lower left side of the screen to pause the simulation.
- Play simulation / one frame forward
- After clicking pause, you'll notice that the pause button turns into a play button. Click the play button to restart the simulation.
- Pressing pause also lights up the smaller button to the right of the pause button. This smaller button allows particles to shift one frame forward.
Question 6.1.1
Click "reset", add one heavy particle. Immediately watch the pressure gauge. What has to happen for the pressure gauge to change from 0.0 atm?
Question 6.1.2
What is the highest pressure observed when one heavy particle is in the chamber?
Question 6.1.3
|
Click "reset", add 50 heavy particles. What is the highest pressure observed? |
Question 6.1.4
Use what you learned using the simulation above and your prior knowledge of gas behavior to write a definition for pressure.
6.2. Defining Pressure
Let's look at a GIF of the simulation we just used so we can understand what causes pressure on a microscopic level.
The pressure gauge remains at 0.0 atm until the moment a particle collides with the wall of the container. The pressure gauge then reads a pressure, but goes down again until another particle collides with the wall.
Question 6.2.1
Reexamine your definition of pressure from page 1. Rewrite your definition of pressure to include information from this page.
6.3. How Does the Number of Gas Particles Affect Pressure?
Pressure can be defined as the frequency and force with which gas particles collide with the walls of their container.
Since we are examining pressure and number of particles in this simulation, we need to make sure that the other two variables (volume and temperature) are held constant.
This is the set-up you will need to complete the data table below:
- Click "Ideal".
- Under "Hold Constant", click "Volume (V)". The program does not allow you to hold two things constant at the same time, but as long as you do not manipulate the "hot-cold" switch the temperature will remain at 300 K.
- Click the green plus sign next to particles.
- Click the double rightward facing triangle below "Heavy" to add 50 heavy particles at once.
- Wait until all particles from the pump have had a chance to hit a wall of the container, then record the highest pressure observed.
- Press the reset button, then repeat steps #2-5 two more times.
- Complete steps #2-6 for 100 heavy particles and 150 heavy particles.
Question 6.3.1
To complete the following data table, you will first set up the simulation as described above. Then, run the simulation with 50, 100, and 150 heavy particles. For each particle amount, record the highest pressure observed. After you have collected data for all nine trials calculate average pressures for 50, 100, and 150 heavy particles.
Question 6.3.2
Is the relationship between number of particles and pressure direct or inverse? Justify your answer by citing evidence from your data table in question 3.1 above.
6.4. The Relationship Between Number of Particles and Pressure
If we graph the data we acquired on page 3 (your data is shown on this page for your reference), our graph would look something like this:

The graph pictured above shows a direct relationship between the two variables (number of gas particles and pressure), that is, as number of particles increases, pressure also increases.
Question 6.4.1
Use the definition of pressure (the frequency and force with which gas particles collide with the walls of their container) to explain why increasing the number of gas particles increases pressure when both temperature and volume are held constant.
6.5. How Does Volume Affect Pressure?
Now we will examine how volume affects pressure. Again, we need to make sure that the other two variables (number of particles and temperature) are held constant.
This is the set-up you will need to complete the data table below:
- Click "Ideal".
- Click the green plus sign next to particles.
- Click the double rightward facing triangle below "Heavy" to add 50 heavy particles at once.
- Under "Hold Constant", click "Temperature (T)".
- In order to adjust the container's volume, click "Width" and you will see a ruler appear under the container. Reduce the width to 5.0 nm, then record the highest pressure observed.
- Press the reset button, then repeat steps #2-5 two more times.
- Complete steps #2-6 for widths (volumes) of 10.0 nm and 15.0 nm.
Question 6.5.1
To complete the following data table, you will first set up the simulation as described above. Run the simulation with 50 heavy particles at each width listed in the table. For each container width (volume), record what the highest pressure observed. After you have collected data for all nine trials, calculate average pressures for 5.0 nm, 10.0 nm, and 15.0 nm widths (volumes).
Question 6.5.2
Is the relationship between volume and pressure direct or inverse? Justify your answer by citing evidence from your data table in question 4.1 above.
6.6. The Relationship Between Volume and Pressure
If we graph the data we acquired on page 5 (your data is shown on this page for your reference), our graph would look something like this:

The graph pictured above shows an inverse relationship between the two variables (volume and pressure), that is, as volume increases, pressure decreases.
Question 6.6.1
Use the definition of pressure (the frequency and force with which gas particles collide with the walls of their container) to explain why decreasing volume increases pressure when both temperature and the number of gas particles are held constant.
Lesson 7 Overview
Examining the effect of temperature on pressure
Lesson 7 Activities
- 7.1. Predicting the Change in Pressure
- 7.2. Data Collection
- 7.3. Data Analysis
- 7.4. Pressure vs. Temperature
- 7.5. The Kelvin Scale
7.0. Student Directions and Resources
In our last lesson, we began to explore pressure. We observed how changing both the number of particles and volume affected pressure. We saw that the number of gas particle and pressure have a direct relationship, while volume and pressure have an indirect (or inverse) relationship.
In this lesson, we will examine the effect of temperature on pressure.
We will also be introduced to a new temperature scale in which we will record the temperature of a gas.
7.1. Predicting the Change in Pressure
Below is a video of your instructor measuring the pressure of a sample of room temperature gas inside a flask. Pressure will be measured in units called kiloPascals (kPa). Watch the video and then answer the questions below.
Question 7.1.1
What is room temperature?
Question 7.1.2
What is the pressure of the room temperature gas?
Question 7.1.3
Predict how lowering the temperature of the gas will affect pressure. Also explain why you believe lowering temperature will have that effect based on your knowledge of gas particle movement and our definition of pressure.
Question 7.1.4
Predict how raising the temperature of the gas will affect pressure. Also explain why you believe raising temperature will have that effect based on your knowledge of gas particle movement and our definition of pressure.
7.2. Data Collection
Now your instructor will measure the pressure of a sample of gas inside a flask when the flask in submerged in both hot water and cold water. Pressure will be measured in units called kiloPascals (kPa). Complete the data table below after you view the video.
Question 7.2.1
Record temperature and pressure for all three gas temperatures measured.
7.3. Data Analysis
In order to analyze your acquired data, you will use Google Sheets. A template for Google Sheets has been created for you and can be found on Google Classroom.
- Notice the data table has already been created for you. Enter the temperature data at room temperature.
- Now enter temperature data for both cold/ice water and hot water.
- Now enter pressure data for all temperatures. A graph should appear in a box that previously said "No data".
- Add a trendline to the graph by opening the chart editor and clicking on “series” and clicking the “add trendline” box. The default trendline is linear which is what you want.
- Then answer the questions below.
Question 7.3.1
Upload an image of your graph by taking a screenshot and uploading it as a file into the answer box.
Screenshot Instructions
laptop: Use the snipping tool to highlight an area on the screen that can then be saved to your Google Drive.
Macbook: Command + shift + 4 then highlight the area on the screen that can be saved to your Google Drive.
Chromebook: Ctrl + switch key (button that allows you to switch between windows on top row) will allow you to save your screenshot in your Google Drive.
Upload files that are less than 5MB in size.
| File | Delete |
|---|---|
Upload files to the space allocated by your teacher.
Question 7.3.2
Describe the relationship that you observe between pressure and temperature. Is it a direct or inverse relationship?
Question 7.3.3
At what temperature does the pressure of the gas equal zero?
Question 7.3.4
Do you think temperature can keep dropping indefinitely? Why or why not?
Question 7.3.5
What do you think a pressure of zero would indicate?
7.4. Pressure vs. Temperature
The graph you created on the last page should look very similar to the one shown below.

Notice the approximate temperature where pressure equals zero is -273 oC, this is no coincidence. -273 oC = 0 Kelvin, which is also known as absolute zero.
Absolute zero is the lowest theoretical temperature possible; it is the temperature at which all particles cease movement. If particles are not moving, they cannot hit the walls of their container and therefore also have no pressure.
7.5. The Kelvin Scale

The Kelvin temperature scale is used when describing gases. This is because the Kelvin scale is directly proportional to the kinetic energy of the gas particles. Thus, 0 K (absolute zero) means no kinetic energy. If particles have no kinetic energy, then they are not moving and cannot cause any pressure inside their container. This is why absolute zero (0 K) is also where pressure equals zero.
This temperature scale will become especially important when we begin gas calculations. Gas variable relationships we have explored can be expressed as mathematical equations. For example, as temperature decreases, so does volume, so if temperature is cut in half, volume will also be cut in half. This mathematical relationship will only hold true if the temperature is in Kelvin.
The Kelvin scale has no negative temperature as there can be no negative volumes, no negative pressures, and no negative number of particles.
The formulas to convert from the Celsius scale to Kelvin and back again are shown below. You will need them to complete the questions at the bottom of the page.
Celsius to Kelvin: K = oC + 273
Kelvin to Celsius: oC = K - 273
Question 7.5.1
Convert 0 oC to Kelvin.
Question 7.5.2
Convert 293 K to Celsius.
Question 7.5.3
What is 300 K in Celsius?
Question 7.5.4
Convert -55 oC to Kelvin.
Question 7.5.5
Convert 95 oC to Kelvin.
Question 7.5.6
Convert 22 oC to Kelvin.
Question 7.5.7
What is 0 K in Celsius?
Question 7.5.8
What is 43 oC in Kelvin?
Lesson 8 Overview
Designing a procedure to pick and test an independent variable that affects the percent crush of a pop can
Lesson 8 Activities
- 8.1. Variables Involved in Crushing a Can
- 8.2. Planning Your Experiment
- 8.3. Conducting Your Trials
- 8.4. Data Visualization
- 8.5. Exploring the Can Crush Simulation
- 8.6. Conducting Your Trials Again Using the Simulation
- 8.7. Simulation Data Visualization
- 8.8. Explaining the Can Crush on a Particle Level
8.0. Student Directions and Resources
In this lesson, you will design a procedure to test the independent variable of your choice to determine how that independent variable affects the overall percent crush (your dependent variable) of a pop can.
You will collect data in class over several class periods. You will create a graph of that data, analyze your graph, and use a simulation to check the validity of your data. After checking the validity of your data, you will compose a claim based on your data.
You will be asked to support your claim with evidence, and finally asked to explain why your evidence supports your claim using scientific reasoning.
8.1. Variables Involved in Crushing a Can
Below is a video of your instructor crushing a can (this will also be demonstrated in class) and a video demonstration of the can crush simulation you will be using later in this lesson. Watch both videos and then answer the questions below.
Question 8.1.1
List every variable you observed that could be manipulated in the can crush demonstration and/or the simulation.
Question 8.1.2
What measurement appeared in the simulation immediately after the can crushed? Explain what you believe this measurement means. (Review the the last 10 seconds in the demonstration video.)
8.2. Planning Your Experiment
Now you will plan a controlled experiment. A controlled experiment is one that has a single independent variable, a single dependent variable, and all other variables held constant (controlled).
You may choose any one of the following as your independent variable: initial water amount, water temperature, can volume (if different size cans are available), or the amount of time the can is left on the hot plate. Percent crush will be the dependent variable for every experiment as that is what is being measured.
Remember whatever independent variable you choose that all other variables must be held constant. For example: if you decide to manipulate the water temperature (in the bucket), that is the only variable that can be manipulated. So in this particular experiment, the initial water amount, the can volume, and the amount of time the can is left on the hot plate must be constant in every trial conducted.
Your experiment must consist of nine trials, three trials for each data point. You will then calculate the average of the three trials at each data point. So using the above example of changing the water temperature, your group would need to conduct three trials using an ice bath, three trials using room temperature water, and three trials using hot water (while measuring the actual temperature of each for each trial).
In order to begin, your group must successfully crush a can and measure all of your variables including: initial water amount, water temperature, can volume (if different size cans are available), and the amount of time the can is left on the hot plate. These settings should be used as constants for all variables that are not your independent variable in each and every trial.
Question 8.2.1
Which variable will be your independent variable?
Question 8.2.2
What measurements will you use for your independent variable?
(For example, if you are changing the amount of water in the can, you might use 5 mL, 10 mL, and 15 mL.)
Question 8.2.3
List the three variables you will hold constant in your experiment.
Question 8.2.4
What set measurements will you use for each of your constants?
8.3. Conducting Your Trials
Use your experimental design on page 2 to complete three trials for each data point you are testing for your independent variable.
In order to measure the volume of each can you will need to fill it with water, then measure that amount of water using a graduated cylinder. This measurement should be taken before (initIal volume) and after (final volume) each can crush trial.
The formula to use for percent crush is:

If your group makes any known errors during a trial, you should consider that trial an outlier and complete it again.
Question 8.3.1
Fill in the data table below with your percent crushes as you complete three trials for each data point that you are testing. Then calculate the average percent crush for each data point.
8.4. Data Visualization
In order to determine the relationship between your independent and dependent variable, you will need to create a graph. In order to create a graph within this interface, we will employ the same online data analysis platform we utilized in Lesson 3 called CODAP. Below, you will see a CODAP workbench.

- The platform is below these instructions. Start by typing your independent variable in the table where it currently reads "Replace with Independent Variable". (Your independent variable is one of the following: initial water amount, water temperature, can volume, or amount of time the can is left on the hot plate.)
- In order to create a graph, drag your independent variable to the x-axis of the plot as shown in the GIF on the right; the example GIF uses water temperature as an independent variable.
- Drag the % Crush variable to the y-axis of the plot as shown in the GIF on the right.
- Observe the resulting plot. Then answer the questions below the CODAP workbench.
In lesson 4, we learned how to identify trends in a graph of two variables for both a direct relationship and an inverse relationship.

But what if your graph doesn't clearly exhibit either of the relationships in the graphs shown above? There is another possibility that we have yet to discuss, that is two variables exhibiting no relationship. If adding a trendline to your data displays a line with a slope close to zero (a horizontal line), then your variables are said to have a no relationship. A graph of two variables (A and B) with a no relationship is shown below.

Question 8.4.1
If there is a clear trend in your graph, identify it (direct or inverse). If there is not a clear trend (no relationship) then state that.
8.5. Exploring the Can Crush Simulation
You will now use a simulation to help determine the reliability of the data your lab group acquired during class.
Experiment with the simulation by manipulating any of the variables (initial water amount, water temperature, or can volume). Be sure to hit "setup" after adjusting these variables or the change will not be reflected in the simulation. Also consider amount of time the can is left in the fire as a variable.
After you feel you have learned all the features of the simulation move on to answer the questions below:
Question 8.5.1
The box "see-inside?" was not checked when you opened the simulation. Describe what happens when you check this box.
Question 8.5.2
Is the simulation more like the real can crush with the "see-inside?" box checked or unchecked? Explain why.
Question 8.5.3
There is a graph called "particles in the cross-section" in the upper right of the simulation that corresponds to the "see-inside?" check box from question 2.1 above. Do the particles in this cross-section represent every particle inside the can? Explain how you were able to determine that.
Question 8.5.4
What is the purpose of including features in a simulation that do not mimic the real world?
8.6. Conducting Your Trials Again Using the Simulation
Use your experimental design on page 2 to complete three trials for each data point you are testing for your independent variable using the simulation below.
Question 8.6.1
Fill in the data table below with your percent crushes as you complete three trials for each data point that you are testing. Then calculate the average percent crush for each data point.
8.7. Simulation Data Visualization
We will again utilize CODAP to create a graph of your simulation data.
- Start by typing your independent variable in the table where it currently reads "Replace with Independent Variable". (Your independent variable is one of the following: initial water amount, water temperature, can volume, or amount of time the can is left in the fire.)
- In order to create a graph, drag your independent variable to the x-axis of the plot as shown in the GIF on the right; the example GIF uses water temperature as an independent variable.
- Drag the % Crush variable to the y-axis of the plot as shown in the GIF on the right.
- Observe the resulting plot. Then answer the questions below the CODAP workbench.
Question 8.7.1
If there is a clear trend in your graph of your simulation data, identify it (direct or inverse). If there is not a clear trend (no relationship) then state that.
Question 8.7.2
Does your simulation data graph show the same trend as your data from the actual can crusher experiment? Explain how the graphs are similar or different in your answer and why you believe this to be the case.
8.8. Explaining the Can Crush on a Particle Level
Throughout the KMT unit, we have been presented with experiments that involve the following variables: temperature, volume, pressure, and number of particles. The Can Crusher is not different in this aspect. Temperature in our experiment is seen both in the water temperature, and in the amount of time the can is left on the fire. Volume is seen in both the can volume and in the measurement of percent crush. The number of particles is seen in the initial water amount added to the can to start the experiment, and finally, pressure is obviously a factor (though not measured directly) throughout the experiment.
What is different in the Can Crusher experiment is that none of the variables (temperature, volume, pressure, or number of particles) are actually held constant throughout the experiment. In this case, identifying a simple relationship between two variables is impossible. In other words, the can crushing cannot be explained by simply stating that as pressure increases, volume decreases. The temperature was not held constant and neither were the number of particles in the can (the can remains open to the air as it is being heated, so particles in the can are allowed to escape). Stating that as temperature decreases, volume decreases cannot explain the entire phenomenon either as pressure is also changing through the experiment.
Explaining the can crush will require that you focus on what particles are doing on a microscopic level throughout the entire process. The can crush simulation includes a check box labeled "see-inside"; the simulation is included again below so you can perform a trial (or trials) while this box is checked. Be sure to observe the particles in the can throughout the entire can crush, then answer the questions below.
Question 8.8.1
Describe the movement of the particles from the moment you place the can in the fire until the can has been in the fire for at least 60 seconds.
Question 8.8.2
What effect would this movement (from question 6.1 above) have on pressure inside the can? Explain why.
Question 8.8.3
How does the particle movement in the can change as the can is taken from the fire and flipped upside down into the ice bath?
Question 8.8.4
What effect would this movement (from question 8.3 above) have on pressure inside the can? Explain why.
Question 8.8.5
Describe how the particles are moving in the can after it is crushed.
Question 8.8.6
Based on the particle movement after the can is crushed, what has happened to the internal pressure in the can? Why?
Question 8.8.7
Notice the graph of particles in the cross-section at the right of the simulation. If you leave the can (with any initial amount of water in the can) in the fire long enough, particles will start to leave the cross-section. Explain this particle behavior.
