Think back to a time when you could smell something cooking in an oven before you entered the room.
How is it possible for you to smell something cooking before you can see it?

To be updated
Cite the Modelsim research

In this activity, students discuss odors and why things can be smelled from a distance. The teacher releases an odor from two sources in the room. Students record when they detect the odor as well as the strength of the odor over time. After observing a “play back” visualization of the detections patterns recorded by all the people in the room, students analyze the data using a computational model. Students share prior knowledge and ideas about particles and molecules that they believe are relevant and might help account for the observed phenomenon. The teacher then demos the next model the students will use. The students take interactive notes about the capabilities of the gas particle “sandbox” model and choose a research topic/question (of their design) to investigate related to gas particle interactions.
 In this activity, you will discuss odors and why things can be smelled from a distance. You will need to call upon and share your prior knowledge and ideas about particles and molecules that might help account for the observed phenomenon. You will also use a computational model to explore this phenomenon.
Today we begin our unit on the particulate nature of matter, or PNoM for short. Throughout this unit you'll have the opportunity to ask questions about why matter behaves the way it does and you'll be given the tools and freedom to find answers to those questions!
The first activity in this unit is on detecting odors.
Think back to a time when you could smell something cooking in an oven before you entered the room.
How is it possible for you to smell something cooking before you can see it?
 “What patterns are there in how odors travel?“
Predict
Your teacher will open two containers at different locations in the room at about the same time, both containing the same substance, but at different temperatures. The substance is one that will have a recognizable odor.
What patterns do you think you will see in which people will detect the odor first?
Which people in the room do you think will be the last to detect the odor?
Now that you've considered how odors behave in a room, you will get to experience it directly. Your teacher will bring out some odors and allow them to diffuse throughout the room. While this happens, record your observations and thoughts and then answer the questions below.
What do you observe while the odor is diffusing throughout the room? Consider taking note to the intensity of the smells you experience and any changes you notice over time. Take note of who smells the odors first in the classroom and what happens to the odors over time.
 After experiencing odor diffusion in a room, you may have a better idea of what affects this process. Answer the questions below to explore this.
Then consider how we can model particle movements during diffusion?
How do you picture the odor moves from each container throughout the room? Draw a sketch below
Why do you think odor levels may fluctuate up and down for some people in the room over the length the entire experiment?
What do you know about gases and molecules that may help further explain your answers?
What variables or factors might affect how an odor spreads across a room?
In the next activity you will be working in a team of two people to build a model of the phenomena you observed. Using a "sandbox" model -- which is a model that provides the tools, agents, and behaviors of a system, but allows you to design the system -- you will attempt to replicate the behavior of odors as they move around a room.
The model is introduced below. Here is how you can run the model:
1. Press the SETUP button on the top left to reset the model.
2. Press the GO/STOP/ADD ELEMENTS button the run the model. This button will turn dark blue meaning the model is actively running.
3. You can pause the model by clicking the GO/STOP/ADD ELEMENTS button again.
Explore the model freely and answer the questions below.
How can particles of different substances be distinguished from one another?
How can solid obstacles be added to the model?
How can removable obstacles (such as doors or lids) be removed or replaced in the model?
How can molecules be sped up or slowed down?
What visualization cues can change in the model to help you better see the relative speed of the molecules?
Once you have made a model, how will exporting the world help you conduct future experiments?
You will need to carefully consider the mechanism you are trying to model. In the space below, explain what mechanism you believe is responsible for the patterns observed in odor diffusion and describe how you intend to test whether or not your hypothesis is correct.

In this activity, students plan the design of the sandbox model they will construct on the computer to investigate their chosen research question/topic. Students build the model, save it periodically, and “run” it to explore its behavior and revise the model. Students will also record outcomes they discover in the model related to a research question. Finally, students will plan an outline for a scientific explanation. This explanation will cite data from the model as well as known scientific principles about gas particle interactions. Students will write the scientific explanation that answers the research question they posed.
 In this activity, you will plan the design of a model that you will then construct on the computer to investigate the diffusion of odor. You will then use this model to come up with a scientific explanation that answers your research question.
In the previous activity, you began to explore some of the basic properties of particles in a gaseous state. You did this by exploring a phenomenon called diffusion. Today, you'll have the opportunity to choose a mechanism you believe led to the patterns observed in odor diffusion, and study this further using the Virtual Particle Sandbox model.
To guide your explanation of particle motion, you will need to form a focus question that you will investigate. Based on your observations of diffusion and introduction to the mode, try to come up with a single question to explore with the model You will write the question you are interested in investigating on the next screen.
Now that you have been introduced to how odor diffuses throughout a space and brainstormed possible factors that may influence this, you will work to develop a model that represents this phenomenon. To guide your model, you will focus on one specific aspect of odor diffusion. To do this, first, think of a question that you can explore using the Diffusion Sandbox model that you explored yesterday. Then, write it in the box below and answer the following questions.
Write the question you will focus on in your investigation below.
Provide a hypothesis below that proposes a possible answer to your question. It should predict both 1) an outcome to your experiment as well as, 2) a mechanism that helps explain why that outcome would occur.
Plan what you will need to add into the model to conduct the experiment. Next to each, state what this would actually represent in the world around you.
Here is a list of things that you should consider including or excluding:
If you choose to include an item, please list it in the table below. You can add more rows to the table with the green plus on the left side.
Now you can begin to use the model to find an answer to the focus question you developed. This question is presented below for your reference as you interact with the model and answer the questions below.
Below is the sandbox model you were introduced to yesterday. You can also see your research question from the previous step right below the model. Design your initial experiment and save it.
Note: It is very important for you to keep in mind that you are going to keep working on the same model and improving it. So, plan accordingly.
Next, test your model to see how the particles move in it.
When you've collected your data, you may want to average some measurement values that changed over the course of many runs. For example, if you ran the model three times with the same starting conditions, you might want to average the value of your dependent variable (pressure, number of molecules, time, etc) over those runs. Furthermore, you may want to consider the following questions as you refine your model:
In the space below, record any observations made during model runs.
In the table below, include any data or observations you made during model runs of the sandbox model.
You will now prepare a scientific explanation to answer the question you proposed to focus on at the beginning of the activity.
A scientific explanation has:
Make an outline of these elements using the questions below.
What scientific principles did you (re) discover about temperature?
What scientific principles did you (re) discover about particle motion?
What data would you like to use as evidence from the model?
What data would you like to use as evidence from the in class physical experiment?
Write the claim you want to assert below.
Write a full scientific explanation using your answers to the questions on the previous screen to guide your writing. Be sure to also draw connections between evidence cited and the claims you aim to make!
Check which modeling assumptions you believe were oversimplified in the computer model, and should be changed in order to explore how odors move across the room more realistically?

In this activity, teacher demonstrates how virtual detectors can be added to the students' models. Students plan what type of sensors to deploy in their model and deploy these sensors in the sandbox model they created in the previous activity. As they test their model, they should revise their sensor designs and/or model conditions to either 1) better align with the behavior of the odor diffusion phenomena experienced as a class or 2) to provide stronger evidence for the causes of state changes and fluctuations in the detector reading in their model. Students rewrite their previous scientific explanation to include the new evidence from their virtual detector measurements. Students will eventually present their findings to the class.

In the previous activity you planned and carried out an experiment concerning the diffusion of gases. To collect data, you used sensors that we provided you. In today's activity you will attempt to quantify the results of your experiment by programming sensors into your sandbox model.
The big question: How can sensors help me analyze patterns of change?
In the previous activity, you wrote a scientific explanation to the topic and focus question that you are examining with your experimentation in the model. Now, work with another classmate to refine your explanation from before, using the criteria below to guide you.
Claim
Evidence
Reasoning
What was your question? (You can copy from Lesson 2)
What was your explanation? (You can copy from Lesson 2)
What is your refined answer after you working with another student?
To strengthen your claim and to understand gas particle behavior further you will be able to add detectors to your computer model. You will be able to design the detectors that you will be using ,as well. What kind of data would be most useful for the detectors to report? Some examples are:
What do you think would be useful data for the sensor(s) to report?
Below is the sensors sandbox model you were introduced to yesterday. You can also see your research question from the previous step right below the model.
Note: In this step, just focus on making sense of which sensors you have, how do they work, and what you can do with them . Do not try change the sensor code yet.
There are four types of detectors. What is the maximum number of detectors you can add of each type?
If you wanted every type of detector to detect the same way, what do you need to do?
If you wanted to use two different types of detectors, each of which detects differently what would you need to do?
How can you change the detector code so that it detects more than one color of particle?
What type of pattern(s) will you program your sensors to identify to help you see data more clearly (you may check more than one)?
In this last step, you will modify the code of the sensors to identify patterns in your model.
Note: Do not change the code of the EXAMPLE 1, EXAMPLE 2, EXAMPLE 3, or EXAMPLE 4 windows. These codes are provided to you so that you can copy them and paste them to the code windows in case you want to reset the code of a sensor or try a new code.
Next, test your model to see how the particles move in it by turning the MOUSE-INTERACTION chooser to "none - let particles move"
Repeat any of these steps until the sensor data either:
Record the relevant data from the model run that you intend to use in the following step.
If you want to use the world you have set up or changed in this step with more sensors in the next step, save your world for future usage.
In the table below, record any important data made or calculated during model runs in the sandbox model. (Could be better as a file upload of an excel file containing behavior space data).
In the space below, record any observations made during model runs in the sandbox model.
What interesting patterns did you discover in the data, what additional evidence for your scientific explanation do you now have, and/or what important mechanisms are at work that could explain some (or all) of the patterns in the data?
(Re)write a full scientific explanation using your outline from your previous investigation and your data from this investigation to guide your writing. Be prepared to present your explanation to your class.
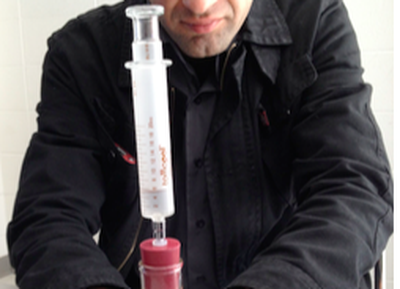
In this activity students brainstorm how compressible objects filled with air (such as air mattresses) are able to hold up the weight of a heavy object. Students then predict and observe the behavior of a plastic syringe. Using a basic syringe model in NetLogo students explore how the plunger level is related to air particle density on either side of the plunger. Students predict and explore the effects of pushing or pulling on the syringe plunger on the net forces acting on the syringe plunger. Students then design an experiment to test predictions about how particles in and outside of the syringe respond to these external forces. Finally, students using what they know about particle behavior, students explain how an inflatable air mattress can hold an individual and why the mattress returns to its original shape after the weight has been lifted. The teacher leads a consensus building discussion on particle interactions that account for these behaviors.
 In previous activities, you had a chance to explore the particulate nature of matter. Specifically, you experimented with how gas particles diffuse throughout a room and how that behavior changes with temperature. In this activity, you will continue to experiment with gas particles and work to understand how the movement of these particles relates to pressure.
Purpose: How can objects inflated with air hold up the weight of other objects?
Overview: To investigate this question, you will record observations of a syringe filled with air, you will model the syringe together as a class, and will analyze the results from the model to explain the behavior of the syringe.
Brainstorm around this topic by considering the following questions. Include your response in the question below.

Why do inflatable objects (such as an air mattress or a workout ball) change shape when you sit or lie on it?
If the object is only filled with air, how is it that it can hold your weight up?
Question
"Why can I compress or expand a syringe filled with air?"

Predict
You will be given a syringe filled with only air and will cover the open end of it with your finger to close it off. Once the syringe is closed you will try to push down on the plunger. With the syringe still closed you will also try to pull the plunger out.
With the syringe capped at the end, do you think you will be able to push the plunger all the way down so that there is no volume left in the syringe for the air?
What do you expect to feel as you push the plunger down more and more?
With the syringe still capped at the end, what do you expect to feel as you pull the plunger out a bit?
With the syringe still capped at the end, if you let go of a plunger that you pushed in, what do you expect will happen to it?
Answer the questions below based on the observations you just made with the syringe.
Why does the plunger tend to return to where it started after you release the pressed in (or pulled out) plunger?
Why do you think it became harder to pull the plunger out, when you expanded the air in the syringe more?
Why do you think it became harder to push the plunger in, when you compressed the air in the syringe more?
Question
"Why does the plunger push back when I push on it?"
Model Rules
Your teacher will demonstrate a new model that represents the syringe. The blue wall will represent the edge of the plunger in the syringe. It is allowed to move back and forth within the piston depending what pushes or pulls on it. It can not move further then the edge of the syringe.

How do you think the motion of the plunger wall will compare when particles are put on only the inside or only the outside of the syringe compared to when particles are put on both sides of the syringe?
 Set the MOUSE-INTERACTION to "none - let particles move" (you can choose anything else) so that you control when the particles begin to move.

 Set the MOUSE-INTERACTION chooser to anything that isn't "none - let particles move", Press SETUP, and then GO/STOP/ADD ELEMENTS to run the model again.

Why does the plunger move to one end of the syringe when particles are put on only one side of the plunger?
Why are there some minor fluctuations in plunger position when particles are put on both sides of the plunger?
Why does the plunger position remain relatively stable when particles are put on both sides of plunger?
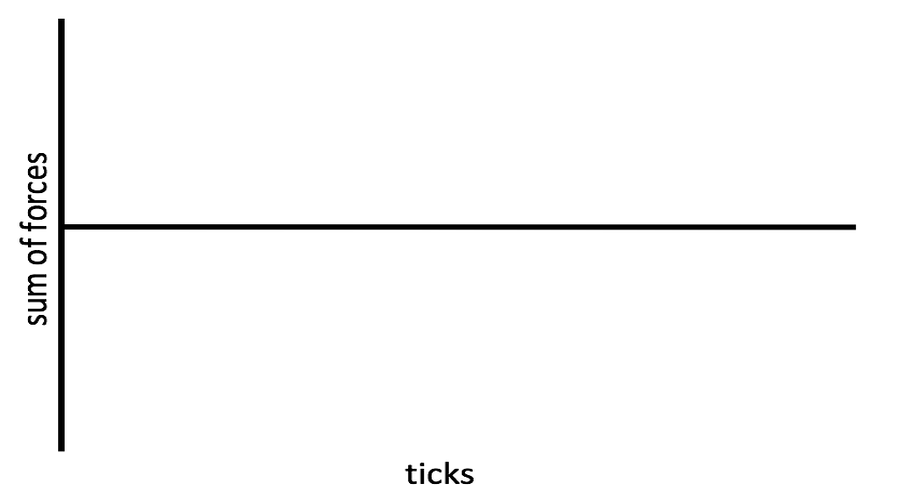
We are now going to start experimenting with a modified version of the virtual syringe model that will allow you to simulate applying upward and/or downward forces by drawing a force graph.
Watch the short video below that demonstrate how to draw an applied force vs. time graph in the model. Pay close attention to which part of the graph represents a push applied to the plunger, and which part represents a pull applied to the plunger.
Positive forces represent an external pull and negative represent an external push.
 Notice that part of this graph on the right represents no external push or pull applied to the plunger.
Predict
The plunger position will start at 0. The maximum plunger level is 15 (pulled all they way out) and the minimum is -15 (pushed all the way in). What will the shape of the graph look like over the time of model run for the force graph above? Write your answer below:
Sketch your prediction for the graph of the plunger position over the time of model run for the force graph seen in the previous question.

Now it is your turn to experiment with the Virtual Syringe Force graph model.
Sketch the Plunger Level graph for the previous run.

Sketch the Net Particle Forces line (that appears in the "Forces on Syringe Plunger" graph) from the previous run.

Compare the shape of these three graphs:
Why does the trapped air in the bottom part of the piston tend to push back more, the further the piston is pressed down?
Why does the general trend of the Net Particle Forces graph appear to be the additive inverse of the External Forces Graph?
If you used the graph below as a script to follow for pushing and pulling on the plunger of a real syringe, describe what you would doing during first half of the graph? What would be different during the second half of the graph?

If you ran the graph below as the external forces for the syringe model, with air on both the inside and outside of the syringe, sketch your prediction of how the plunger level of the piston would change over time to the right.


Sketch the Plunger Level graph for the previous run.

Sketch the Sum of Forces line (that appears in the "Forces on Syringe Plunger" graph) from the previous run.
How do the actions of the particles, both inside and outside of the syringe, lead to a situation where the net force on the plunger is zero during a plunger pull?
When pulling the plunger, at what point are the net forces on the plunger equal to zero?
How do the actions of the particles, both inside and outside of the syringe, lead to a situation where the net force on the plunger is zero during a plunger push?
When pushing the plunger, at what point are the net forces on the plunger equal to zero?
What aspects (if any) of your prediction for the plunger position graph, matched the outcomes in the model?
Now that we've completed a number of explorations about how force interacts with pressure, lets revisit the questions asked at the beginning of the activity.
Why does an object filled with air return to its original shape when you release the pressure you've placed on it?
An inflatable object (such as an air mattress or a workout ball) changes shape when you sit or lie on it. If it is only filled with air, why can it hold you up?

In the last activity you explored how air particles inside of a syringe act when pushing and pulling on the plunger. In this next activity you'll explore how those same air particles act inside of a syringe when the temperature of the air is also changed.
 In the last activity, you explored how air particles inside of a syringe act when pushing and pulling on the plunger. In this next activity, you'll explore how those same air particles act inside of a syringe when the temperature of the air is also changed.
Purpose: How does temperature impact the interactions of air particles?
Read the brainstorm topic questions below, then write your response.
How does temperature impact the interactions of air particles?
How might changing the temperature of the air inside the syringe, impact the interactions between the air molecules?
GOING TO PLACE A VIDEO HERE THAT SHOWS AN EXPERIMENT IN WHICH A SYRINGE IS CONNECTED TO A FLASK. THE EXPERIMENTER HEATS THE AIR INSIDE THE FLASK BY COVERING IT WITH HIS HANDS AND DEMONSTRATES HOW THE POSITION OF THE PLUNGER.
In a moment your teacher will be demonstrating an interesting phenomenon. Make careful observations and record them in question 1 below. Then answer the following questions.
1. What are some changes you observed occur in the glass syringe system during the demonstration?
2. Why do you think the syringe behaved in the way it did?
3. What was the independent variable in the demonstration (what condition did the teacher change that then led to the changes in the behavior of the system)?
4. What was the dependent variable in the demonstration (what property of the system appeared to be affected by the change the teacher made)?
Keep thinking about your teacher's demonstration.
Sketch a graph showing the plunger level graph as it changed over the course of the demo.

Sketch a graph showing the temperature of the air inside of the flask as it changed over the course of the demo.

We are now going to experiment with another version of the Virtual Syringe model, this time through manipulating a temperature graph instead of a force graph.
Sketch the Plunger Level graph for the previous run.

Sketch the Net Particle Forces line (that appears in the "Forces on Syringe Plunger" graph) from the previous run.

What relationship did you discover between temperature and pressure?
How do pressure changes account for plunger level changes?
Question: How can I generate cyclical motion in a piston?
Design An Experiment
A piston is similar to a syringe. Pistons are used in car, train and many airplanes to convert up and down motion in the piston into circular motion. The very first steam engines used pistons to turn train wheels on trains and paddle wheels on steam boats, and a variety of other machines. Below is an animation of a piston. This piston has two nozzles on the top instead on one (like the syringe) and its plunger stick can rock back and forth, so that it can be attached easily to a wheel.

What do you notice about the piston. How is it moving?
In what way will you vary the temperature to try to get the syringe to act like the piston?
Sketch a graph showing how you plan to vary the temperature of the air inside of the syringe to get the plunger repeatedly travel up and down like in the picture below.

Use the virtual syringe temperature model to recreate the piston behavior.
Now that we've completed a number of explorations about how temperature interacts with pressure, and you've built a syringe model that mimics a piston, answer the questions below:
In a system, how are temperature changes related to pressure changes?
Why would changing both the air temperature inside the syringe and the air temperature outside by the same amount, cause no change in the plunger position?
How might changing only the outside air temperature, but keeping the air temperature inside the syringe constant, cause the syringe to move?
How might the air molecules inside a syringe behave differently, if the air temperature inside the syringe did not change, but the outside air temperature decreased dramatically?
How might the air molecules inside a syringe behave differently, if the air temperature inside the syringe decreased dramatically and the outside air temperature did not change?

Will be updated.
 In the last activity you explored how pressure and temperature might impact the gas inside of a closed container. As part of this unit, you also attempted to replicate the behavior of a steam piston in your syringe sandbox model. However, we did not consider the role of water in this model (as steam is heated water). In an earlier activity, you also explored how an odor travels through a room. However, we did not consider that the odor came from peppermint oil, a liquid.
Purpose: How do substances change from one state to another?
Consider the question of how substances change from one state to another.
How does a substance change from a liquid to a gas or from a gas to a liquid?
Consider what other factors might cause particles to "clump" together like they do in a liquid?
Gravity may have an effect on whether or not particles act like a gas or liquid. Think about your previous work with particle sandbox models. How could we add gravity to those models?
While conducting the experiment described in the previous steps, answer the questions below:
1. Record the observations you made during the virtual experiment.
2. How did the movement of the particles in this model compare to the movement of particles in previous activities?
3. How did the graph you drew of gravity compare to the graph made by your classmates?
4. Did the graph you made cause the particles to act like a liquid?
In reality, gravity is essentially the same throughout the room or a given container. For that reason, we should use a constant amount of gravity despite the height of the particles. Try drawing in a constant value for gravity and observing the particles.
When gravity is set to a constant, do particles behave as if they are a liquid? Describe their behavior and any observations you made during the experiment below.
Watch the video below:
How does a substance change from a liquid to a gas or from a gas to a liquid?
Consider the video above that shows alcohol evaporating. What do you think happens in the container with water? Would it act the same as alcohol and nail polish?
Now watch the video again.
Why do you think water evaporates differently than alcohol? What other forces might be acting on the particles in a liquid?
Sketch a graph of the intermolecular forces that you think exist for water.

How do you think this graph compares to the graph of intermolecular forces for the alcohol from the video?

While conducting the experiment described in the previous step, answer the questions below:
Record the observations you made during the virtual experiment.
How did the movement of the particles in this model compare to the movement of particles in previous activities?
The graph used in this model is similar to a graph of the attractive and repulsive forces in water. Now, your teacher will do a demonstration that shows these forces in alcohol. Would you expect a graph of the alcohol used in the teacher demonstration to be the same? Describe what you think that graph would look like and why.
Using the same model, try to replicate what you watched in the video with alcohol and nail polish.
Record your observations below
Now that we've completed a number of explorations about how forces such as gravity, as well as forces between particles change the way particles behave, answer the questions below:
While water didn't evaporate quickly when it was placed on the table, how might we speed up this process? Be sure to explain your answer from a particle perspective!
What would happen if we placed a fan so that it continually blew air over the puddle of water on the table. How would this impact evaporation? How would this change the way the particles interacted?
What would happen if the puddle of water was on a hot plate that was slowly increasing in temperature. How would this impact evaporation? How would this change the way the particles interacted?
If we wanted to keep the water from evaporating, what are some ways we could accomplish this? Be sure to explain your answer from a particle perspective!

Will be updated soon.
 You should now be feeling more comfortable with how particles interact with one another. In particular, we've spent a lot of time experimenting with how particles in a gaseous state interact and how properties such as pressure and temperature emerge from those interactions. You've also been introduced to a model that shows how particles in a liquid state act differently than those same particles in a gaseous state. In this activity, we'll begin to theorize about how particles might shift between the liquid and gas state.
Consider how you might model evaporation and boiling?
Read the brainstorm topic below, then write your response in the blank box.
How might you model evaporation and boiling? Consider what is happening to the molecules of a liquid when it is boiling and what type of observations would you want to make in order to give you evidence that a liquid was boiling?
Question: What causes boiling?
Predict: Watch the video below that shows an interesting phenomenon. Use your observations to answer the following questions.
Is this an open or closed system?
Before experiment, observe the liquid in the flask. Is it boiling?
How can you tell?
If the experimenter did not heat or cool the liquid any more, but simply pushed or pulled on the syringe, would that alone be enough to cause the liquid to start boiling? Why?
Watch the liquid closely as the experimenter pushes and pulls on the syringe. Answer the following questions.
What do you observe is happening in the liquid?
If someone claimed that pulling on the syringe is changing the boiling point of the liquid, what evidence would support that claim?
Question: How can we model boiling?
Model
 As a group model to explain why changing the pressure of the air above the liquid might be changing whether the liquid boils or not.
Based on the models you made, sketch the predicted shape of the graph of the pressure of the air in the syringe as the plunger is pulled upward over time.

Based on your models, sketch the predicted shape of the graph of the concentration of water molecules in the air as the syringe is pulled upward over time.

If the syringe could be compressed to half the volume as the syringe before, would that affect concentration of water molecules in the air above the syringe?
Question: How can we model evaporation?
1. Will water evaporate as fast in a closed system as in an open system?
2. Why?
Consider the following experiment and its results. Then answer the questions below.
| Substance & Condition | Time to evaporate completely |
| Drop A: 1 drop of rubbing alcohol in a closed system | Unknown if it will happen at all, but if it does happen at some point it will take over 8 hours. |
| Drop B: 1 drop of rubbing alcohol in an open system | About 2 hours. |
At 10 seconds after the experiment for each of the two conditions: Draw a model of the initial drop of liquid in a closed system after 1 hour.
At 10 seconds after the experiment for each of the two conditions: Draw a model of the initial drop of liquid in an open system after 1 hour.
Step 1 – You are going to create a molecular model of the drop of liquid evaporating. A drop of alcohol has millions of billions of alcohol molecules in it. This is too many for you to draw in a model. So pick a reasonable number of molecules to represent in a drop of alcohol that you can draw quickly.
Step 2 - Draw a model to show the molecules of alcohol in a drop of alcohol. Include the same key as before, using circles to represent one type of molecule and hexagons to represent another type.
How is evaporation similar to boiling?
How is it different?
How do the behaviors of evaporation and boiling both depend on the presence of gravitational force and on intermolecular attaction-repulsion forces?
How does your model help explain why the drop in the open system evaporates more quickly than the one in the closed system?
Your teacher will assign your group one of these factors. Check the box next to the factor you are assigned below:
Why would changes to that factor probably affect the rate of evaporation?
