Summarize the three factors that create storms.

Overview
Weather Basics - storm formation
In this lesson, students build on their knowledge of factors in the Great Lakes system. They dig deeper into the formation of thunderstorms, and connect the presence of thunderstorms with the presence of moisture and rising warm air. Through this lesson, students should see the two factors we are discussing - increased temp and precipitation, and that these are occurring in events (thunderstorms) that will be stronger on average than in the past.
Standards
Next Generation Science Standards
- Earth and Space Sciences
- [MS-ESS2-4] Develop a model to describe the cycling of water through Earth’s systems driven by energy from the sun and the force of gravity.
- NGSS Crosscutting Concept
- Patterns
- Energy
- Stability and Change
- NGSS Practice
- Analyzing Data
- Constructing Explanations, Designing Solutions
- Using Models
- Conducting Investigations
Computational Thinking in STEM
- Data Practices
- Analyzing Data
- Collecting Data
- Visualizing Data
- Modeling and Simulation Practices
- Using Computational Models to Understand a Concept
- Constructing Computational Models
- Systems Thinking Practices
- Understanding the Relationships within a System
Activities
- 1. Text 1: Factors of Storm Formation
- 2. Text 2: Climate Change and Extreme Weather
- 3. Text 3: For the Midwest, Epic Flooding Is the Face of Climate Change
- 4. Storms: Lake Effect Snow
- 5. Trends in Great Lakes Storms
- 6. Revise GL Sage Modeler
Student Directions and Resources
We have discovered that the temperature in the great lakes is rising, and precipitation is likely to increase as well. We have modeled the energy and matter flow in the water cycle, and discovered the factors that govern humidity.
In this lesson, a text set will allow you to explore information about storms, and how the components in the system may change storm frequency or strength. As you read, take time to annotate, ask questions, and re-read. You may need to revisit different pages to develop a full explanation of what is happening.
1. Text 1: Factors of Storm Formation
Read this first text or watch the video to learn more about how thunderstorms form.
How does a thunderstorm form?
Source: National Oceanic and Atmospheric Administration (NOAA)
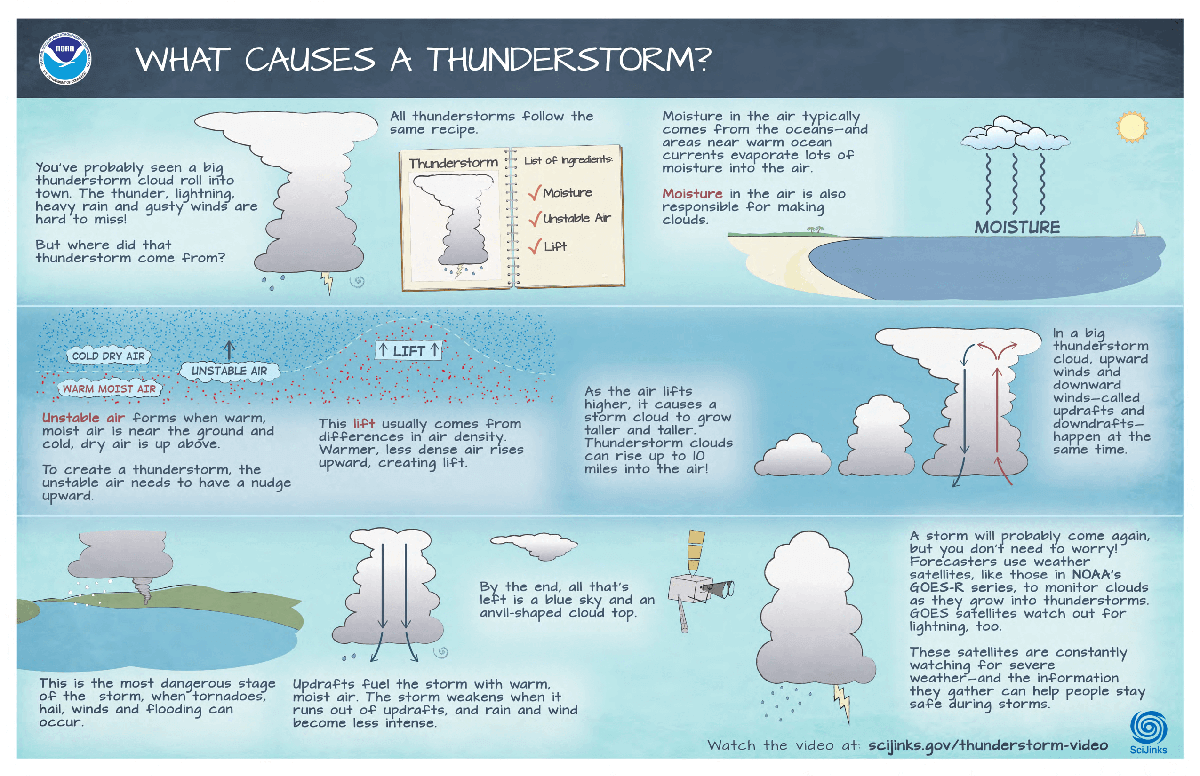
Video Link: https://scijinks.gov/thunderstorms-video/
Question 1.1
Question 1.2
Make at least 2 connections between thunderstorm formation and what you know about humidity.
Question 1.3
Describe a connection between formation of thunderstorms and what you know about transfer of energy.
Question 1.4
Think about how the Great Lakes system currently functions. What change in the Great Lakes system could impact this function, perhaps cause changes in frequency or strength of storms?
2. Text 2: Climate Change and Extreme Weather
Extreme weather gets a boost from climate change
Source: Environmental Defense Fund
Scientists are detecting a stronger link between the planet's warming and its changing weather patterns. Though it can be hard to pinpoint whether climate change intensified a particular weather event, the trajectory is clear — hotter heat waves, drier droughts, bigger storm surges and greater snowfall.
Storms and floods
As more evaporation leads to more moisture in the atmosphere, rainfall intensifies. For example, we now know that the rainfall from Hurricane Harvey was 15 percent more intense and three times as likely to occur due to human-induced climate change. We expect to see a higher frequency of Category 4 and 5 storms, also, as temperatures continue to rise.
While scientists aren't certain about whether climate change has led to more hurricanes, they are confident that rising sea levels are leading to higher storm surges and more floods.
Around half of sea-level rise since 1900 comes from the expansion of warming oceans, triggered by human-caused global warming. (Like all liquids, water generally expands as it heats up.) The rest of the rise comes from melting glaciers and ice sheets.
Snow and frigid weather
There is more moisture in a warmer atmosphere, which can lead to record snowfall.
It may seem counterintuitive, but the increase in snowfall during winter storms may be linked to climate change. Remember — there is more moisture in the warmer atmosphere. So when the temperatures are below freezing, snowfall can break records.
And scientists are studying a possible connection between a warming Arctic and cold spells in the eastern United States. The idea is that a rapidly warming Arctic can weaken the jet stream, allowing frigid polar air to travel farther south.
Question 2.1
Why are changes in storms, floods, and snowfall connected to rising temperatures?
Question 2.2
You may be familiar with the term, "polar vortex," which is associated with extremely cold temperatures that persist for a few days. Explain how this phenomenon is connected to climate change, based on what you read in the article.
3. Text 3: For the Midwest, Epic Flooding Is the Face of Climate Change
For the Midwest, Epic Flooding Is the Face of Climate Change (abridged)
By: MEGAN MOLTENI, 05.24.2019
Source: Wired.com
Scientists say it’s too early to tell to what degree this particularly relentless spring storm season is the result of human-induced climate change. But they agree that rising temperatures allow the atmosphere to hold more moisture—about 7 percent more for every 1 degree rise in Celsius—which produces more precipitation and has been fueling a pattern of more extreme weather events across the US. And perhaps more than any other part of the country, the Midwest has had its capacity to store excess water crippled by human developments like paved or concrete surfaces.
In 2015, researchers at the University of Iowa studied historical records of peak discharges from more than 700 stream gauge stations across the Midwest. Their analysis, reported in Nature, found that between 1962 and 2011, the magnitude of flood events hadn’t changed much. At a third of the locations, however, the number of floods was trending upward significantly.
More recent work, published in February by scientists at the University of Notre Dame, shows that floods aren't just getting more frequent—they'll also get more powerful in the future. Using a statistical method to blend data from global climate models with local information, the researchers predicted that the severity of extreme hydrologic events, so-called 100-year floods, hitting 20 watersheds in the Midwest and Great Lakes region will increase by as much as 30 percent by the end of the century. The approach, called “Hybrid Delta downscaling,” has been used to look at hydrological dynamics in other parts of the country before, but it was never applied to the Midwest. “What we’re seeing is that the past really is not a good predictor of the future,” says the study’s lead author, Kyuhyun Byun. “Especially when it comes to extreme weather events.”
In Byun’s case, the evidence is as much in his computer simulations as it is in his own waterlogged backyard. In South Bend, Indiana, where Notre Dame is located, the city is still recovering from back-to-back biblical deluges—a 500-year flood last spring preceded by a 1,000-year flood in 2016 that broke all historical records.
Besides all the damage to homes, businesses, and municipal infrastructure, increasingly frequent flooding events in the Midwest would have a huge impact on the nation’s ability to produce food. Wet fields make it difficult for farmers to operate their large, heavy planting machinery without getting stuck. And seedlings struggle to develop root systems when there’s too much moisture in the ground.
Question 3.1
This article attributes many of the changes in climate in the midwest to which factor?
Increase in moisture in the air
Decrease in temperature
Decrease in moisture in the air
Longer summer season
Decrease in temperature
Decrease in moisture in the air
Longer summer season
Question 3.2
Dr. Byun's research is discussed in this article. Given what you know of computer simulations, how do you think he uses them in his research?
4. Storms: Lake Effect Snow
Lake effect snow is a localized storm phenomena that results from a combination of variables.
When the lakes are not completely frozen over and the temperature of the lake is warmer than the temperature of the air, conditions are present that allows the air to increase the water vapor content. Air holds a certain amount of moisture dependent on its temperature. The amount of moisture in the air compared to the amount the air can hold is called relative humidity.
As wind currents move west to east (across the lake) and cold air moves down from Canada over the lakes, the air picks up moisture from the warmer lake and deposits it on the eastern or southeastern side (downwind) of the lake. This results in lake effect snow.
An increased rate of warming in the northern Great Lakes allow for more moisture to be absorbed. This may result in larger lake effect snow events to the east of a lake (see image).

Question 4.1
What does this text and image tell you about winter precipitation in the Great Lakes region?
Question 4.2
Explain how this text connects to the water cycle. What process is happening as the air moves over the warmer lake?
Question 4.3
Explain how this text connects to the humidity lab.
5. Trends in Great Lakes Storms
Connect the four texts to explain what is happening in the Great Lakes region.
Question 5.1
Why might thunderstorms around Chicago become more intense, distributing more rainfall on the area? Be sure to use evidence from at least 2 of the articles.
Question 5.2
Sometimes you hear people say that global warming is a "hoax" because it is cold or snowy. How would you respond to them to explain why a large snowstorm or persistent cold is occurring?
Question 5.3
If you could work on a research team, like the ones that provided the information in the articles, what question would you want to investigate to learn more about this? Do you have ideas for what resources or tools you would use?
6. Revise GL Sage Modeler
In the Sage Modeler file below, use what you have learned to connect variables to storm strength.
Refer to Sage Modeler Guide for help drawing arrows, setting relationships, and labeling.
Question 6.1
Add a screenshot of your model with humidity added.
Screenshot:
To take a screenshot:
Step 1: Hold down the Ctrl and Shift keys at once, then press the Switch window button.
Step 2: Chrome’s cursor will be temporarily replaced with a crosshair. Click and drag a square across the portion of the screen you want to save, then release the trackpad or mouse button.
The partial screenshot will be saved in the Downloads folder, the same as a full screenshot.

Upload files that are less than 5MB in size.
| File | Delete |
|---|---|
Upload files to the space allocated by your teacher.
Question 6.2
Explain what you connected on the sage modeler above. Why did you choose to connect those specific variables?
Question 6.3
Explain using the connections on Sage Modeler how increasing global temperature leads to stronger thunderstorms or an increase in winter precipitation. Discuss what you read in the prior pages and refer to specific parts of sage modeler that connect.
