It only became widely accepted knowledge that all matter in the world is made up of tiny elementary particles in the early 19th century.
Let's look at the the picture below. What do you think this image is a model of?

Students will develop an understanding of experimental design, data collection, and data analysis by conducting a laboratory experiment and using a computational model to study the behavior of pillbugs, also called 'roly-polies' (Armadillidium vulgare).
This curricular unit is co-designed by Teresa Granito and Sugat Dabholkar.

This is an introductory lesson for using certain types of computational models designed using a software called NetLogo.
In this lesson, students will learn:
how to computationally study the spread of wildfire
how to engage in the scientific inquiry practices of constructing knowledge in the context of an Emergent Systems Microworld (ESM)
how to engage computational thinking practices in context of an ESM. We will focus on four computational thinking practices: data practices, modeling and simulation practices, computational problem solving practices, and systems thinking practices
Several lessons in this curriculum use computational models designed using a piece of software called NetLogo. In this lesson, we will try to understand what these models are and how to use them.
This lesson specifically focuses on learning science with computational models of emergent natural phenomena. Emergent phenomena are ones in which simple interactions between agents and their environment result in complex patterns. For example, a flock of birds (see below).
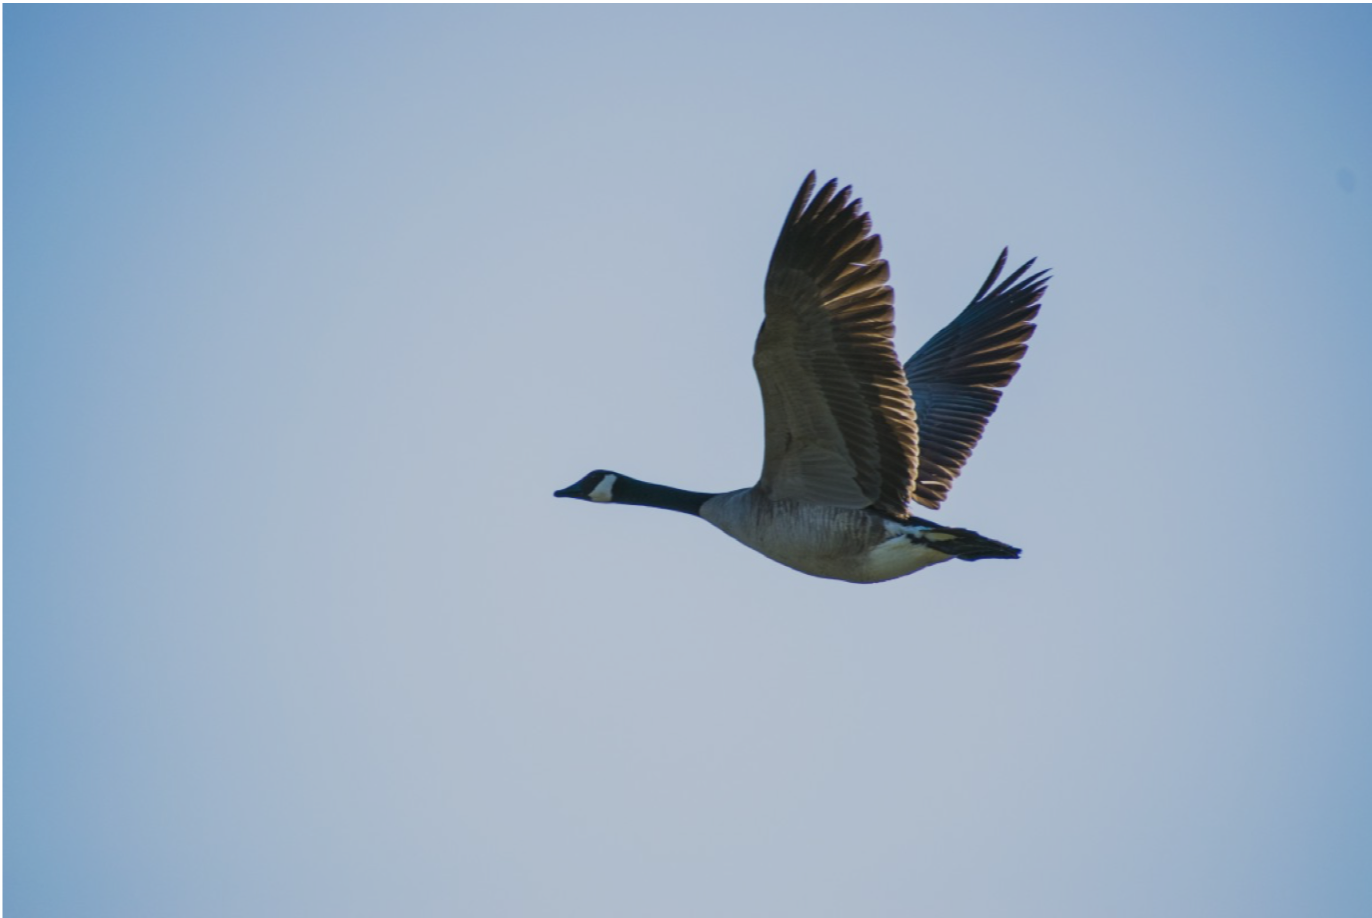
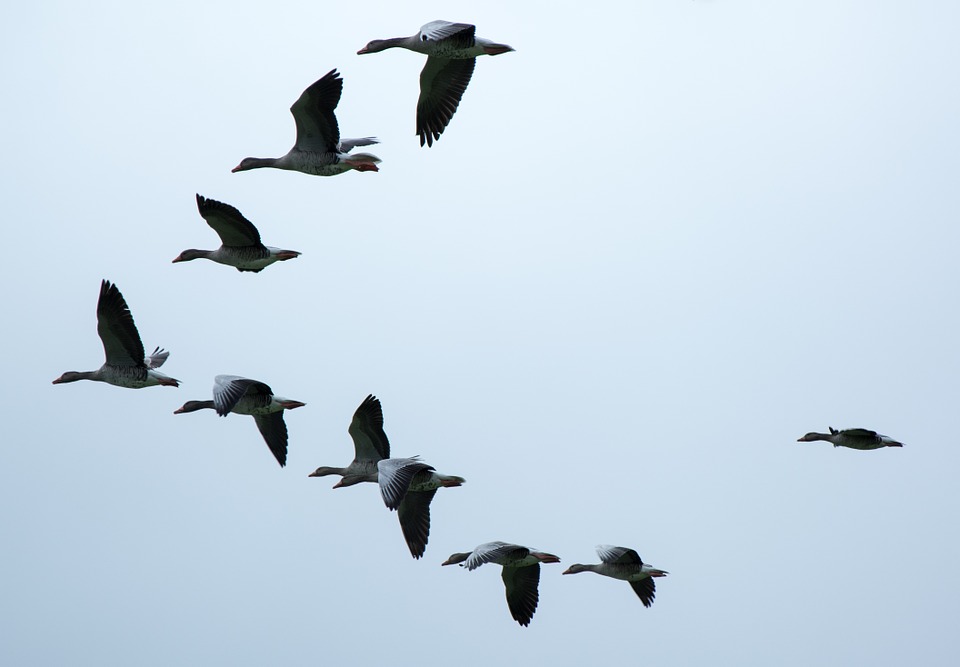
In a flock of birds, most people assume that the "head" bird is a leader of the flock. However, flocks actually emerge from each bird following a simple set of rules regarding alignment, coherence and separation with neighboring birds. This means that the shape of a flock is emergent and not directed by any particular leader bird.
Learning Goals -
Let's get started!
Scientists use scientific modeling approaches to construct knowledge about the world. In this section, we explore the ideas behind scientific models.
It only became widely accepted knowledge that all matter in the world is made up of tiny elementary particles in the early 19th century.
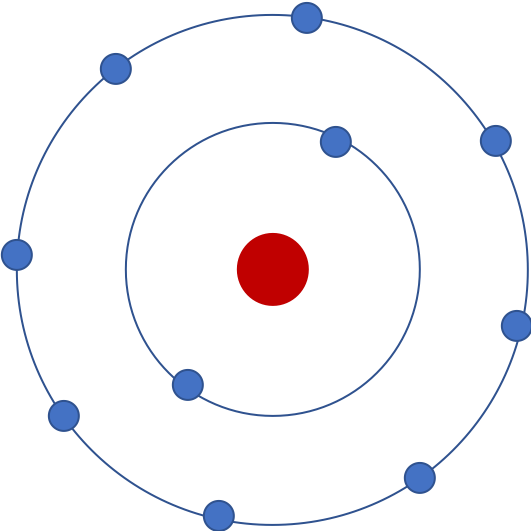
Let's look at the the picture below. What do you think this image is a model of?
Some of you probably said it's a model of an atom. Others might say it's a model of a 'Neon atom', because it has 10 electrons. In fact, since we don't know the number of protons, it could be an ion of a different element!
The point is that these representations in a model allow us to think about natural phenomena (like atoms containing electrons) that are associated with the model in certain way. Can you think of what this particular model could be useful for?
Now, let's look at a computational model of a forest. Imagine that you have a drone with a camera that is hovering above a forest. In other words, this model shows a top-down view of a forest. Each green patch you see represents a tree. A red patch represents a burning tree.
Play with the model and make some observations.
What do you think a researcher or scientist could use this model for?
Make sure to change the density of trees in the model and observe the spread of the fire.
In this model, trees are called agents because their behaviors are programmed into the model using a set of rules.
An example of one such rule is a tree cannot move. Another is when a tree is on fire, it turns red.
How might you write a rule for a tree to model the spread of fire?
Based on your exploration of the model, can you guess how the density of trees affects the spread of the fire in the forest?
This 'fire model' is an example of an emergent systems microworld. It is modeled in terms of interactions between the agents (trees) and it allows us to observe emergent patterns like the spread of fire in the forest. Because it is a computational model, we can easily change parameters such as the density of trees and then study how that change affects the spread of fire in the forest. Although this is just a model, we can use that knowledge to make predictions regarding the spread of fire in a real forest.
However, this model does not include all the factors that affect the spread of fire in a real forest. Can you suggest some other factors that might affect the spread of a real forest fire and that could be added in this model?
Here's a version of a fire model that a team of researchers tried to modify, but it does not run as they expected. In fact, it's totally broken and does not run at all.
Can we help them fix it?
Setup the model. What is the mistake (or what you might hear people call a 'bug') in the researcher's model?
You probably noticed that after you press 'setup', you see blue colored trees. Maybe the bug in the code has something to do with the color of the trees. Maybe the color of the tree is set to 'blue' instead of 'green' by mistake.
Click on the bar that says 'NetLogo Code'. You can find it below the big square in the model.
Where does it say 'blue' in the code? And there does it say 'green' in the code?
You can fix that bug! Go to a line that say 'blue' where it should have been 'green'. Change the code.
Click on "Recompile code" and run the model again. Does it work now?
Can you explain why it did not work before?
These computational models, written in NetLogo, allow users to change the code and observe the effect of those changes. That is a very important feature of these Emergent Systems Microworlds: you can play with them and manipulate them by changing the parameters such as 'density' or by changing the code to see how the "microworld" you see is affected.
Now go back to the code and try to read some of it. The NetLogo language is designed to be easy to understand for humans. Pick a line in the code and paste it below. Try to explain how it affects the way the model would behave.
For example,
set initial-trees count patches with [pcolor = green]
This line sets a value for a variable 'initial-tree' by counting the patches that have pcolor (patch-color). This line is written in the NetLogo language that the NetLogo compiler understands.
Let's investigate how the density of the trees affects the spread of a forest fire.
We will first generate some data using the model and then visualize it using another computational tool called CODAP.
Let's follow an experimental design that is described below:
Research Question: How does density of trees in a forest affect spread of a forest fire?
Hypothesis: As the density of trees in the forest increases, the percentage of forest burned will increase linearly. (That means, if density of trees doubles, the percentage of forest burned will also double)
Let's test our hypothesis using the model.
Change the values of density systematically. Record the value of 'percentage forest burned' in the data table. Make sure that you press 'setup' button every time you do a trial. Make sure to run each different value of density twice and finally, make sure you record values for each experimental trial.
CODAP will automatically plot the average of the two values that you will record.
Write some observations about the graph of 'density' vs 'percentage burned'.
Do you think that the evidence that we gathered with our experiment supports our hypothesis?
Explain your answer to the previous question.
Spread of a forest fire is an emergent phenomenon. Below a certain density, the fire does not spread much, however when the density crosses a 'tipping point' or threshold, the fire engulfs almost all the forest.
The tipping point in this model falls within which of the following density ranges?
Can you give an example of another such phenomenon with a tipping point?
Hypothesis Testing
Hypothesis testing refers to procedures used by scientists to reject or fail to reject statistical hypotheses. It helps us attend to uncertainty and deal with random error in data collected during an investigation.
There are two types of statistical hypotheses:
Null hypothesis (H0): the hypothesis that there is no difference between two groups of data in an investigation and that the experimental observations are the result of chance.
Alternative hypothesis (HA): one of several hypotheses that experimental observations are the result of some nonrandom cause
© 2018 The College Board Quantitative Skills in the AP Sciences Hypothesis Testing 37 CHAPTER 3 Quantitative Skills in AP Biology
Explore a more detailed version of the fire model above.
Explain what "probability-of-spread" might mean in the model and how it would affect the behavior of the model.
Write a question that is of interest to you which can be investigated using this model.
An example of such a question would be: How does wind-speed affect the spread of fire?
Based on your exploration of the model, make a guess, and state it in the form of testable statements (hypotheses) – ones that you can test using the model. Write a null hypothesis and an alternative hypothesis for your research question.
Design an experiment to test your null hypothesis. Describe the independent and dependent variables and the control treatment for the null hypothesis you wrote.
Perform the experiment. Describe your observations and explain whether those support your null and alternative hypotheses or not.
Provide one example of how using this computational model would benefit researchers.
Provide one example of limitations that researchers might face while using this computational model.

Students will learn about experimental design and data analysis while performing a hands-on animal behavior lab using real roly-polies. In lessons three and four, students will use computational models that simulate individual- or agent-level behaviors and interactions to model animal behavior.
Learning Objectives Adapted from AP Biology Science Practices:
AP science revisions focus on seven overarching practices that capture important aspects of the work of scientists. Science practices describe the knowledge and skills that students should learn and demonstrate to reach a goal or complete a learning activity.
The student can use representations and models to communicate scientific phenomena and solve scientific problems.
The student can use mathematics appropriately.
The student can engage in scientific questioning to extend thinking or to guide investigations within the context of the AP course.
The student can plan and implement data collection strategies in relation to a particular scientific question. (Note: Data can be collected from many different sources, e.g., investigations, scientific observations, the findings of others, historic reconstruction and/or archived data.)
The student can perform data analysis and evaluation of evidence.
The student can work with scientific explanations and theories.
The student is able to connect and relate knowledge across various scales, concepts and representations in and across domains.
Lab modified from https://www.nausetschools.org/cms/lib/MA02212418/Centricity/Domain/204/Animal%20Behavior%20Lab%20with%20Isopods%202017%20FINAL.pdf
Adapted from the College Board AP Biology Student Lab Manual, 2001 edition. Lab 11 Animal Behavior
Learning Objectives Adapted from AP Biology Lab Manual 2012 Lab 12
In this lesson, you will learn the following science practices:
The student can use representations and models to communicate scientific phenomena and solve scientific problems.
The student can use mathematics appropriately.
The student can engage in scientific questioning to extend thinking or to guide investigations within the context of the AP course.
The student can plan and implement data collection strategies in relation to a particular scientific question. (Note: Data can be collected from many different sources, e.g., investigations, scientific observations, the findings of others, historic reconstruction and/or archived data.)
The student can perform data analysis and evaluation of evidence.
The student can work with scientific explanations and theories.
The student is able to connect and relate knowledge across various scales, concepts and representations in and across domains.
In this exercise, you will investigate some innate (inherited, as opposed to learned) behaviors of isopods. In your observations, consider if the isopods are engaging in kinesis or taxis (positive or negative).
Ethology is the study of animal behavior. Many behaviors involve the movement of the animal within its environment.
Ethologists assess various behaviors by placing documented behavior in simple categories. Once the behaviors in these categories are tallied, ethologists can determine the entire lifestyle of the organism, gaining a complete picture of the animal’s existence. Ethology investigates not only what happens in an animal’s existence, but also why it happens. In every ecosystem, organisms are influenced by limiting factors, which are biotic or abiotic factors that regulate the maximum size of a given population and a relatively narrow range of environmental conditions that are favorable to them and their offspring. Since most organisms cannot change the nature of their environment, they must position themselves in an environment with favorable conditions. This behavior is called habitat selection.
Orientation is the process by which animals position themselves with respect to spatial features of their environments. Kinesis is random turning or movement of an animal in relation to a stimulus. Taxis involves the turning of an animal’s body relative to a stimulus. For example, positive taxis is an animal moving toward an object, area, or stimulus. Negative taxis involves an animal moving away from an object, area, or stimulus.
How does kinesis differ from taxis? Which would get to a stimulus faster: animal moving in taxis or kinesis?
Background Information of our Model Organisms
Isopods: Roly-polies (Armadillidium vulgare)
Terrestrial isopods are land-dwelling crustaceans, commonly known as Roly-polies or pill bugs. Related to lobsters, crabs, and shrimp, terrestrial isopods breathe with gills. Roly-polies are humid retreats during the day. Roly-polies can be found in compost piles, leaf litter, and beneath logs. Roly-polies usually feed on decomposing plant matter. Plants decompose with the help of bacteria, which thrive in soil above 4.9 pH. Roly-polies need calcium in their diet to build up their hard protective cuticle, and calcium is not abundant in soils with a pH below 5.5. The ideal soil pH conditions for roly-polies are above 5.5 where calcium is present but below 9, the maximum threshold for soil bacteria.
Based on the background information, where should you look for roly-polies? Describe your prior experience with roly-polies, if you have any.
Materials
10 isopods in a petri dish (with a damp substrate)
Procedure
1. Place 10 isopods and a small amount of damp substrate into a petri dish. Cover the dish with the lid.
2. Observe the isopods for 10 minutes. Your goal is to observe their undisturbed behavior, so do not bump the container.
3. Make detailed notes on their general appearance, movements about the dish, and interactions with each other. Notice if they seem to prefer one area over another, if they keep moving, if they settle down, or if they move sporadically. Pay close attention to any behaviors that involve two or more isopods. Record your observations below.
Write your observations below.
Are the movements of the isopods better described as taxis or kinesis movements? Give details to support your answer.
In this page, you will learn about scientific terminology.
In science, how do we define hypothesis? What is the difference between a prediction and a hypothesis?
A scientific hypothesis has two important qualities. The first is that it is testable. The second is that it is falsifiable (can be proven wrong).
Look at the image above. Use it to write a hypothesis using the "If ... then ... " format.
What is a controlled experiment?
Variables are manipulated or measured in an experiment. An independent variable is one that is manipulated by the scientist; it is what is being tested in an experiment. A dependent variable is measured or observed (typically the data that is collected in an experiment). A change in the dependent variable will show that the independent variable had a direct effect or at least a causal relationship.
The independent variable in the plant experiment above is:
The dependent variable in the plant experiment above is:

A negative control group is a control group that is not exposed to the experimental treatment or to any other treatment that is expected to have an effect.
If you are testing for effects of different quantities of a soluble bio-fertilizer, what would be your negative control?
In this activity, you will observe isopods as they respond to moisture differences in their environment.
Scientific Question: How do differences in moisture affect isopod behavior?
First, identify the variables that you will change and investigate in this experiment.
What is the Independent Variable?
What is the Dependent Variable?
Based on the background information, we might infer that roly-polies might have a preference for moist conditions.
Let's set up an experiment to investigate how roly-polies respond to moisture differences in their environment.
Materials
10 isopods in a petri dish, choice chamber, two pieces of filter paper, dropping pipette, water, stopwatch or timer. Choice chamber is constructed of two plastic petri dishes with a cut-out and taped together.
Procedure
1. Take a choice chamber from the prep area. The choice chamber consists of two large plastic petri dishes with a hallway connecting them.
2. Place a moist piece of filter paper on one side and a dry one on the other.
3. Use a soft brush to transfer ten isopods from the stock culture into the chamber. Transfer 5 isopods to each side of the chamber. Put on the lids.
4. Count and record the number of animals on each side of the choice chamber every 30 seconds for 10 minutes. Record your data in the table on the following page. Continue to record even if they all move to one side or stop moving.
5. Return your isopods to the stock chamber.
Record the condition in chamber 1.
Record the condition in chamber 2.
Record data every 30 seconds.
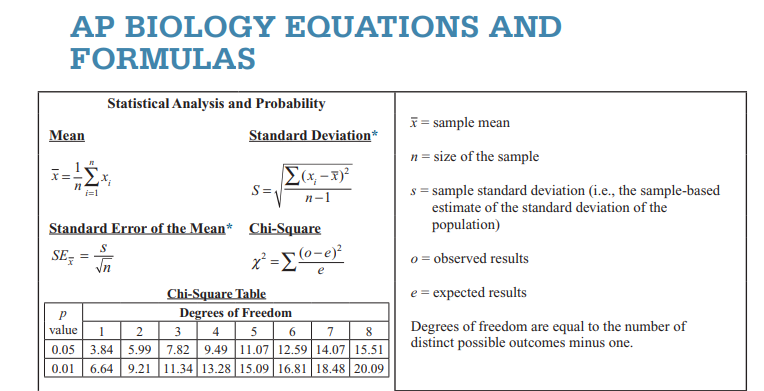
Use the AP Biology Formula and Equation sheet to calculate the Mean, Standard Deviation and Standard Error of the Mean for both chambers. Transfer your results to the table below.
Create (by hand on graph paper) an appropriately labeled graph to illustrate the sample means of the two environments to within 95% confidence (i.e., sample mean ± 2 SEM). Upload a photo of your graph.
| File | Delete |
|---|---|
Make a claim that answers the scientific question "How do differences in moisture affect isopod behavior?"
Justify your claim by using your data as evidence.
Explain your reasoning and why the evidence supports the claim. Connect the data back to what you learned about humidity and orientation behavior in isopods.
Justify the isopod’s behavior as taxis or kinesis.
Propose a research question for future study.

Students will learn about experimental design, and data analysis while performing a hands-on animal behavior lab using real Roly-polies. In the lessons three and four, students will use computational models that simulate individual- or agent-level behaviors and interactions to model animal behavior.
Learning Objectives Adapted from AP Biology Science Practices:
AP science revisions focus on seven overarching practices that capture important aspects of the work of scientists. Science practices describe the knowledge and skills that students should learn and demonstrate to reach a goal or complete a learning activity.
The student can use representations and models to communicate scientific phenomena and solve scientific problems.
The student can use mathematics appropriately.
The student can engage in scientific questioning to extend thinking or to guide investigations within the context of the AP course.
The student can plan and implement data collection strategies in relation to a particular scientific question. (Note: Data can be collected from many different sources, e.g., investigations, scientific observations, the findings of others, historic reconstruction and/or archived data.)
The student can perform data analysis and evaluation of evidence.
The student can work with scientific explanations and theories.
The student is able to connect and relate knowledge across various scales, concepts and representations in and across domains.
Lab modified from https://www.nausetschools.org/cms/lib/MA02212418/Centricity/Domain/204/Animal%20Behavior%20Lab%20with%20Isopods%202017%20FINAL.pdf
Adapted from the College Board AP Biology Student Lab Manual, 2001 edition. Lab 11 Animal Behavior
Learning Objectives Adapted from AP Biology Lab Manual 2012 Lab 12
In this lesson you will….
observe behavior of isopods and draw conclusions about their behavior
record data about isopod behavior
change variables to determine if the isopod behavior is random or deliberate
calculate standard deviation, standard error and chi-square tests
recognize elements in experimental design including: observation, hypothesis, variable to be tested, control, data, and conclusions
In this activity, you will design and conduct your own experiment investigating isopod behavior.
Background Information of our Model Organisms
Isopods: Roly-polies (Armadillidium vulgare)
Terrestrial isopods are land-dwelling crustaceans, commonly known as Roly-polies or pill bugs. Related to lobsters, crabs, and shrimp, terrestrial isopods breathe with gills. Roly-polies are humid retreats during the day. Roly-polies can be found in compost piles, leaf litter, and beneath logs. Roly-polies usually feed on decomposing plant matter. Plants decompose with the help of bacteria, which thrive in soil above 4.9 pH. Roly-polies need calcium in their diet to build up their hard protective cuticle, and calcium is not abundant in soils with a pH below 5.5. The ideal soil pH conditions for Roly-polies are above 5.5 where calcium is present but below 9, the maximum threshold for soil bacteria.
Available Materials
10 isopods in a petri dish, choice chamber, stopwatch or timer, list of other materials required:
Conditions
|
temperature |
(cool vs. warm) |
|
light |
(light vs. dark or light vs. shade) |
|
pH |
(neutral pH vs. low pH vs. high pH) |
|
substrate (soil) |
(soil vs no soil) |
|
salinity |
(saltwater vs. freshwater) |
|
substrate (leaf litter/organic matter) |
(leaf litter vs no leaf litter) |
What variable will you test?
What is your Scientific Question?
What is the Hypothesis?
Identify the variables.
What is the independent variable?
What is the dependent variable?
Procedure: Describe the procedure to be followed.
Describe how you ensured that you have a controlled experiment. Did you have to rethink your design to ensure that only one variable was being tested?
Run the controlled experiment you have planned and record your data below.
Record the condition in chamber 1.
Record the condition in chamber 2.
Record data every 30 seconds.
First, you will plot the data to visualize differences in the means of the two environments. You will use error bars (standard errors of the means) to determine if the sample means are statistically different. Then you will use X2 test to test the null hypothesis.
Using Google Sheets, calculate the Mean, Standard Deviation and Standard Error of the Mean for both chambers.
Using Google Sheets, create an appropriately labeled graph to illustrate the sample means of the two environments to within 95% confidence (i.e., sample mean ± 1.96 SEM). Upload a file of your graph.
| File | Delete |
|---|---|
As background information, first, you need to understand that a scientist must create a null hypothesis prior to performing their experiment.
The null hypothesis predicts that you will not see a change in your data due to variation in the independent variable. Specify the null hypothesis you are testing:
Explain if you accept or reject the null hypothesis by comparing the confidence intervals of sample means.
You will calculate the chi-squared value for your data using the formulas above.
Use the tables in the next two questions to organize your data.
Observed: Find the mean (average) number of isopods on each side during the 10 minute time period
Expected: Average of 5 in chamber 1, average of 5 in chamber 2
Fill in the values and calculate X2.
Click here to view the Chi-Square Distribution Table.
Look at the critical value.
Do you accept or reject the null hypothesis on the basis of the X2 test? (This is your Claim.)
Justify the claim by using the calculated chi-square values.
Explain your reasoning.
What are some limits to your experimental design? Propose a refinement to your experimental design that could improve it.
Explain the statistical methods you used in this lesson to test your claim.
Explain how you used a computational tool (e.g., google sheets) in this lesson.
Describe the benefits of using a computational tool for data analysis.
In this lesson, you will start the computational lab.
Please keep in mind that some of the activities/questions are designed expecting that you have done the physical lab. You can attempt those questions based on your expectations about the physical lab or you can skip those questions.
In this lesson, you will learn the following science practices using computational tools:
The student can use representations and models to communicate scientific phenomena and solve scientific problems.
The student can use mathematics appropriately.
The student can engage in scientific questioning to extend thinking or to guide investigations within the context of the AP course.
The student can plan and implement data collection strategies in relation to a particular scientific question. (Note: Data can be collected from many different sources, e.g., investigations, scientific observations, the findings of others, historic reconstruction and/or archived data.)
The student can perform data analysis and evaluation of evidence.
You are expected to do this computational lab after you have finished the physical (wet) experimental lessons.
If you have not done the physical animal behavior lab, you can still go ahead. However, please keep in mind that some of the activities/questions are designed expecting that you have done the physical lab. You can attempt those questions based on your expectations about the physical lab or you can skip those questions.
In this lesson, you will learn the following science practices using computational tools:
The student can use representations and models to communicate scientific phenomena and solve scientific problems.
The student can use mathematics appropriately.
The student can engage in scientific questioning to extend thinking or to guide investigations within the context of the AP course.
The student can plan and implement data collection strategies in relation to a particular scientific question. (Note: Data can be collected from many different sources, e.g., investigations, scientific observations, the findings of others, historic reconstruction and/or archived data.)
The student can perform data analysis and evaluation of evidence.
The model below is of an experimental setup to study habitat preference of a certain type of isopods called rollypollies.
Explore the model above. Change conditions and other parameters.
Write at least two observations that you found interesting or surprising.
You will run the model below after you answer this question. What will happen if you set up the conditions as 10 rollypollies and the two chambers with the same condition (dry/dry or moist/moist) then run for 30 ticks. Write your prediction regarding the distribution of roly-polies in the two chambers.
Don't run the model before you answer this question.
Test your prediction.
Did your results match your prediction? Why or why not?
Suppose we increase the number of roly-polies to 20, run for 30 ticks and repeat.
Suppose we increase the number of roly-polies to 40, run for 30 ticks and repeat.
What do you think will happen? Run the model.
Record your observations about increasing the number of roly-polies. How does this data compare to your prediction in Question 1.2?
Let's discover what happens as you increase the number of ticks.
Set chambers to dry/dry. Start with 20 roly-polies. Time for 5 ticks, make observations. Repeat at least three times.
Record your observations.
Make a prediction regarding the distribution of roly-polies when you change in the amount of time. Write predicted results when you increase the amount of time.
Run the model for 30 ticks. Make observations and repeat the experiment at least 3 times.
Run the model for 1000 ticks. Make observations and repeat the experiment at least 3 times.
What conclusion can you make based on your observations?
In this activity, you will use a computational model to design and conduct your own experiment investigating isopod behavior.
Pick conditions for each of your chambers.
Set the number of roly-polies for your experiment.
Set the number of ticks.
Explain the reasons for your choices in the previous two questions.
Run the model.
Record your observations here.
Collect class data about roly-poly preference from the physical lab (actual experiments with real-world roly-polies). If you have not done the physical (wet) lab, find out the answer using google search. Make sure you use reliable information from the web.
What conditions did the roly-polies prefer?
Chose the conditions you want to test with the computational model.
Write your conditions here.
Now you will code new conditions into the model.
Follow the directions. The screenshots will guide you.
You just modified code and created a new experimental model! Describe your experience.
Ask a Scientific Question that can be assessed by your new model. Write the question.
Make a prediction based on your new conditions. Write your prediction.
Describe your experimental design (initial conditions - number of roly-polies and chamber preference, and the number of ticks).
Explain the reasons for your choices of experimental conditions.
Run the experiment. Write your observations.
Do your predictions match the results of the model? State your evidence.
Explain what you learned in the process of making modifications to this model.
What did you learn about computational modeling after you performed investigations on this page?
How do the results from the computational models compare with the roly-poly experiment you conducted?
What are some advantages of using computational models to predict animal behavior vs the physical lab experiments we conducted at the beginning of the unit?
What are some limitations of the computation models used in this unit? What are some limitations to the physical lab?
How can a computational model aid a scientist with their work?
Write at least one big idea that you learned in this lesson.
In this lesson, you will continue with the computational lab.
Please keep in mind that some of the activities/questions are designed expecting that you have done the physical lab. You can attempt those questions based on your expectations about the physical lab or you can skip those questions.
In this lesson, you will learn the following science practices using computational tools:
The student can use representations and models to communicate scientific phenomena and solve scientific problems.
The student can use mathematics appropriately.
The student can engage in scientific questioning to extend thinking or to guide investigations within the context of the AP course.
The student can plan and implement data collection strategies in relation to a particular scientific question. (Note: Data can be collected from many different sources, e.g., investigations, scientific observations, the findings of others, historic reconstruction and/or archived data.)
The student can perform data analysis and evaluation of evidence.
In this lesson, you will learn how to use automated tools for data collection.
Scroll to the right to see the results table.
Warning alert: After you finish questions on this page and you click Save and Continue, you will receive an error message about leaving this page because your data table has not been saved. You can click Leave without saving. All other responses will be saved.
How is this computational experimental setup different from the one in the previous lesson? Write down any different features and what you think they do.
Play around with the model and design your protocol for data collection.
Your protocol design should include the initial conditions, the number of trials, and the time interval between two readings.
Write your design here.
Run an experimental trial with your protocol and upload a screenshot.
| File | Delete |
|---|---|
Use CODAP to find means and standard deviations of the numbers of roly-polies in each chamber. See the video to understand how to use CODAP. [If the video is not displayed below, please ask your teacher to screen the video.]
What are the advantages of using a computationally automated data collection tool?
Note: The button "run for 30 ticks" makes the model run continuously at '30 ticks increments'.
Play around with the model and design an elaborate experimental protocol.
[Hint: Explicitly state experimental conditions like “number-of-readings”]
Write your design here.
Run an experimental trial with your protocol by clicking the button "run a trial".
[It takes time for a trial to complete. Be patient. After the trial is complete, a data table in CODAP will be automatically populated.]
Upload a screenshot of your experiment.
| File | Delete |
|---|---|
Describe the benefits of computationally enhanced data collection and analysis tools.
For what purpose would a scientist use computationally enhanced automated data collection and analysis tools?
In this lesson, students use a software called NetTango to use coding blocks for constructing a computational model of animal behavior.
In this lesson, you will make your own computational model of roly-polies. You will use a computational tool called NetTango to code animal behavior using blocks.
This is a computational setup designed using a tool called NetTango. This setup will allow you to construct your own computational model of roly-poly behavior. You will use coding block to build a computational model.
Play around with some of the coding blocks and see if you can setup a chamber.
Try the challenges below:
Increase the size of the chamber.
Move the chamber to the left, and to the right.
Move the chamber up, down.
“add-roly-polies”
Make 2 Chambers that are connected.
Add the ‘clear’ block and see how it works.
Setup again and run the model by pressing the ‘go’ button.
Blocks can be used multiple times. Blocks can be dragged to the trash to take them out of the code.
Anytime you make changes click on the "recompile" button followed by setup and go.
You can also watch the embedded video to learn how the use NetTango blocks to add and move roly-polies. [If the video is not displayed, ask your teacher to screen the video.]
What parameters did you change to move a chamber? How do they work?
How did you increase the size of the chamber?
Take screenshots of your 'setup' and 'go' procedures and upload the files.
| File | Delete |
|---|---|
Challenge: Add roly-polies and have them move in a realistic way.
Drag blocks over to make two chambers that are connected. Add roly-polies. Tell the roly-polies how to behave.
Get the roly-polies to move around the field.
Get the roly-polies to move around the field more realistically.
Get the roly-polies to stay within the chambers.
Describe what happened when you first added the roly-polies to the chambers.
Did the roly-polies stay in the chambers? If not, how did you change the code?
Take a screenshot of your chambers and NetTango code (i.e., blocks). Upload the files.
| File | Delete |
|---|---|
You have more blocks now. Use those to setup two chambers and conditions in each chamber.
Which new blocks did you use?
Describe any benefits of the new blocks and any difficulties you faced in using the new blocks.
Upload your screenshots of chambers with conditions and your NetTango code here.
| File | Delete |
|---|---|
Let's use the model from one of the previous lessons, except the "go" button does not work!!
You can make it work by programing behavior of roly-polies using blocks, so that they behave just like how you observed the behaving experimentally.
CHALLENGE: Add Chamber Preference
In the roly-poly animal behavior experiment that we conducted, we learned that roly-polies prefer the moist chamber over the dry chamber. Code for that preference behavior using the NetTango blocks.
Run your model.
Keep changing the parameter in the blocks until the roly-poly behavior in the model more closely matches the roly-poly behavior observed in the experiment we conducted.
Take screenshots of the NetTango code and of the graphs in your model. Upload the files.
| File | Delete |
|---|---|
A few lessons ago, you changed a model by typing lines that setup "new-condition" in a model. Now you changed a model by moving blocks to set up conditions. What are the benefits of using block-based coding like this NetTango model, compared to typing lines of code?
What other blocks would you want to add to this model?
List 5 big ideas about coding that you learned by completing the lessons in this entire unit.

This is an introductory lesson for using certain types of computational models designed using a software called NetLogo.
In this lesson, students will learn:
how to computationally study the spread of wildfire
how to engage in the scientific inquiry practices of constructing knowledge in the context of an Emergent Systems Microworld (ESM)
how to engage computational thinking practices in context of an ESM. We will focus on four computational thinking practices: data practices, modeling and simulation practices, computational problem solving practices, and systems thinking practices
Several lessons in this curriculum use computational models designed using a piece of software called NetLogo. In this lesson, we will try to understand what these models are and how to use them.
This lesson specifically focuses on learning science with computational models of emergent natural phenomena. Emergent phenomena are ones in which simple interactions between agents and their environment result in complex patterns. For example, a flock of birds (see below).
In a flock of birds, most people assume that the "head" bird is a leader of the flock. However, flocks actually emerge from each bird following a simple set of rules regarding alignment, coherence and separation with neighboring birds. This means that the shape of a flock is emergent and not directed by any particular leader bird.
Learning Goals -
Let's get started!
Scientists use scientific modeling approaches to construct knowledge about the world. In this section, we explore the ideas behind scientific models.
It only became widely accepted knowledge that all matter in the world is made up of tiny elementary particles in the early 19th century.
Let's look at the the picture below. What do you think this image is a model of?
Some of you probably said it's a model of an atom. Others might say it's a model of a 'Neon atom', because it has 10 electrons. In fact, since we don't know the number of protons, it could be an ion of a different element!
The point is that these representations in a model allow us to think about natural phenomena (like atoms containing electrons) that are associated with the model in certain way. Can you think of what this particular model could be useful for?
Now, let's look at a computational model of a forest. Imagine that you have a drone with a camera that is hovering above a forest. In other words, this model shows a top-down view of a forest. Each green patch you see represents a tree. A red patch represents a burning tree.
Play with the model and make some observations.
What do you think a researcher or scientist could use this model for?
Make sure to change the density of trees in the model and observe the spread of the fire.
In this model, trees are called agents because their behaviors are programmed into the model using a set of rules.
An example of one such rule is a tree cannot move. Another is when a tree is on fire, it turns red.
How might you write a rule for a tree to model the spread of fire?
Based on your exploration of the model, can you guess how the density of trees affects the spread of the fire in the forest?
This 'fire model' is an example of an emergent systems microworld. It is modeled in terms of interactions between the agents (trees) and it allows us to observe emergent patterns like the spread of fire in the forest. Because it is a computational model, we can easily change parameters such as the density of trees and then study how that change affects the spread of fire in the forest. Although this is just a model, we can use that knowledge to make predictions regarding the spread of fire in a real forest.
However, this model does not include all the factors that affect the spread of fire in a real forest. Can you suggest some other factors that might affect the spread of a real forest fire and that could be added in this model?
Let's investigate how the density of the trees affects the spread of a forest fire.
We will first generate some data using the model and then visualize it using another computational tool called CODAP.
Let's follow an experimental design that is described below:
Research Question: How does density of trees in a forest affect spread of a forest fire?
Hypothesis: As the density of trees in the forest increases, the percentage of forest burned will increase linearly. (That means, if density of trees doubles, the percentage of forest burned will also double)
Let's test our hypothesis using the model.
Change the values of density systematically. Record the value of 'percentage forest burned' in the data table. Make sure that you press 'setup' button every time you do a trial. Make sure to run each different value of density twice and finally, make sure you record values for each experimental trial.
CODAP will automatically plot the average of the two values that you will record.
Write some observations about the graph of 'density' vs 'percentage burned'.
Do you think that the evidence that we gathered with our experiment supports our hypothesis?
Explain your answer to the previous question.
Spread of a forest fire is an emergent phenomenon. Below a certain density, the fire does not spread much, however when the density crosses a 'tipping point' or threshold, the fire engulfs almost all the forest.
The tipping point in this model falls within which of the following density ranges?
Can you give an example of another such phenomenon with a tipping point?
Hypothesis Testing
Hypothesis testing refers to procedures used by scientists to reject or fail to reject statistical hypotheses. It helps us attend to uncertainty and deal with random error in data collected during an investigation.
There are two types of statistical hypotheses:
Null hypothesis (H0): the hypothesis that there is no difference between two groups of data in an investigation and that the experimental observations are the result of chance.
Alternative hypothesis (HA): one of several hypotheses that experimental observations are the result of some nonrandom cause
© 2018 The College Board Quantitative Skills in the AP Sciences Hypothesis Testing 37 CHAPTER 3 Quantitative Skills in AP Biology
Explore a more detailed version of the fire model above.
Explain what "probability-of-spread" might mean in the model and how it would affect the behavior of the model.
Write a question that is of interest to you which can be investigated using this model.
An example of such a question would be: How does wind-speed affect the spread of fire?
Based on your exploration of the model, make a guess, and state it in the form of testable statements (hypotheses) – ones that you can test using the model. Write a null hypothesis and an alternative hypothesis for your research question.
Design an experiment to test your null hypothesis. Describe the independent and dependent variables and the control treatment for the null hypothesis you wrote.
Perform the experiment. Describe your observations and explain whether those support your null and alternative hypotheses or not.
Provide one example of how using this computational model would benefit researchers.
Provide one example of limitations that researchers might face while using this computational model.

