Overview
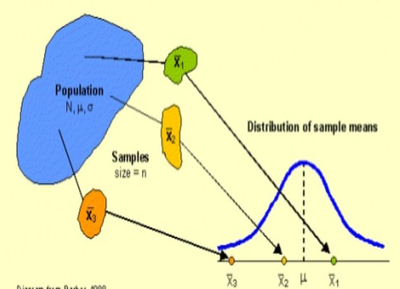
Students will explore the relationship between the shape of the population distribution, the sample size and the shape of the sampling distribution.
Central Limit Theorem demonstrates relations between population distributions and their sample mean distributions as well as the effect of sample size on this relation. In this model, a population is distributed by some variable, for instance by their total assets in thousands of dollars. The population is distributed randomly -- not necessarily 'normally' -- but sample means from this population nevertheless accumulate in a distribution that approaches a normal curve. The program allows for repeated sampling of individual specimens in the population
Underlying Pages
-
0. Student Directions -
Preview as Student
-
1. Exploring Central Limit Theorem in a NetLogo model -
Preview as Student
-
2. Exploring different population distributions -
Preview as Student
-
3. Reflection -
Preview as Student
-
4. Applications -
Preview as Student
-
5. Central Limit Theorem applications -
Preview as Student
-
6. Difference between Two Sample Means -
Preview as Student
-
7. Another difference of sample means problem -
Preview as Student
-
8. Some Final Thoughts -
Preview as Student
Standards
Computational Thinking in STEM 2.0
- Computational Data Practices
- Computational Modeling and Simulation Practices
