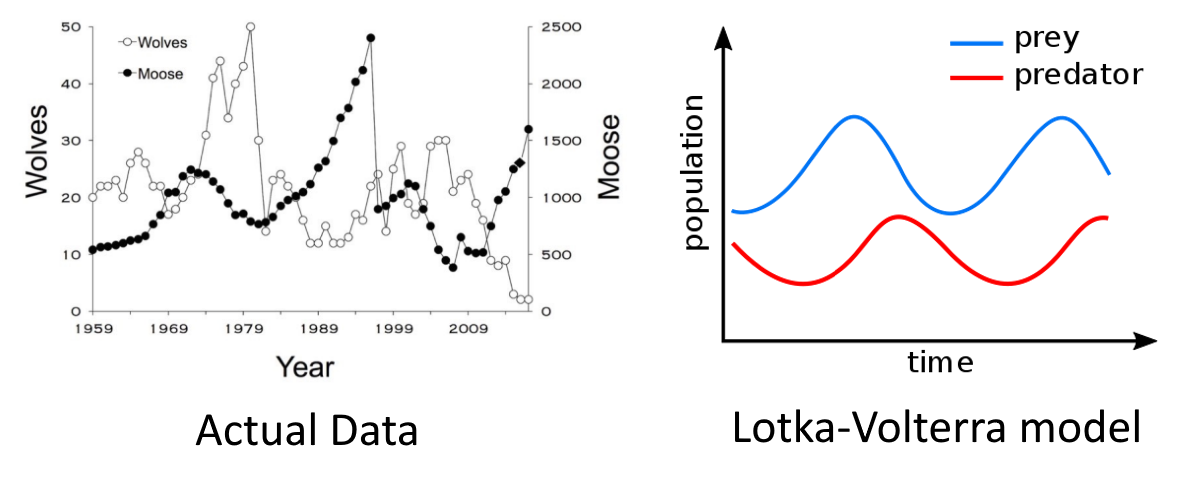
Think back to the activity in Lesson 1 where you modeled a simple ecosystem consisting of predators (wolves) and prey (moose). As you may have observed during that activity, predator and prey populations oscillate over time. A graph of population data from Isle Royale is shown below as an example of these oscillations. Two scientists (Lotka and Volterra) modeled these oscillations using differential equations. A graph of these equations is provided for comparison.

The equations used in this model state that these population oscillations are based on the birth and death rates of the predators and prey. The model also claims that the prey death rate and the predator birth rate are proportional to the number of prey caught by the predators.