Preview - Animal Behavior Lab (Isopods)

Analysis: Design an Experiment to Test Isopod Behavior with addition of chi-square analysis


Statistical test and data analysis

First, you will plot the data to visualize differences in the means of the two environments. You will use error bars (standard errors of the means) to determine if the sample means are statistically different. Then you will use Xtest to test the null hypothesis.


Questions

Please answer the questions below.

Using Google Sheets, calculate the Mean, Standard Deviation and Standard Error of the Mean for both chambers.


Using Google Sheets, create an appropriately labeled graph to illustrate the sample means of the two environments to within 95% confidence (i.e., sample mean ± 1.96 SEM). Upload a file of your graph.

Upload files that are less than 5MB in size.
File Delete

As background information, first, you need to understand that a scientist must create a null hypothesis prior to performing their experiment.

  • If the dependent variable is not influenced by the independent variable, the null hypothesis will be accepted.
  • If the dependent variable is influenced by the independent variable, the data should lead the scientist to reject the null hypothesis.

The null hypothesis predicts that you will not see a change in your data due to variation in the independent variable. Specify the null hypothesis you are testing:


Explain if you accept or reject the null hypothesis by comparing the confidence intervals of sample means.


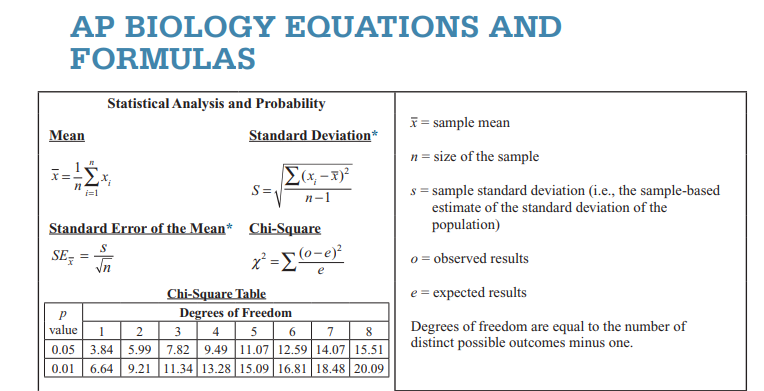
You will calculate the chi-squared value for your data using the formulas above. 

Use the tables in the next two questions to organize your data.  

Observed: Find the mean (average) number of isopods on each side during the 10 minute time period

Expected: Average of 5 in chamber 1, average of 5 in chamber 2


Fill in the values and calculate X2.


Click here to view the Chi-Square Distribution Table

Look at the critical value.

  • If the chi-squared value is greater than the critical value, then you reject the null hypothesis. This means that the variation in the data is due to a variable.
    • X2  >  critical value
  • If the chi-squared value is less than the critical value, then you accept the null hypothesis. This means that the variation in the data is due to chance.
    • X2  <  critical value

Do you accept or reject the null hypothesis on the basis of the X2  test? (This is your Claim.)


Justify the claim by using the calculated chi-square values.


Explain your reasoning.


What are some limits to your experimental design? Propose a refinement to your experimental design that could improve it.


Notes

These notes will appear on every page in this lesson so feel free to put anything here you'd like to keep track of.